Diagrams for Cloud Architecture Security
Diagramming your AWS or Azure Cloud security posture is always a good idea and can highlight vulnerabilities that are hard to spot using just your...
Whether you're dealing with public, private, or hybrid cloud models, these diagrams play a pivotal role in planning, deploying, and managing cloud resources efficiently. They provide clarity, facilitate collaboration, and act as a foundational tool for cloud strategy, migration, and optimization.
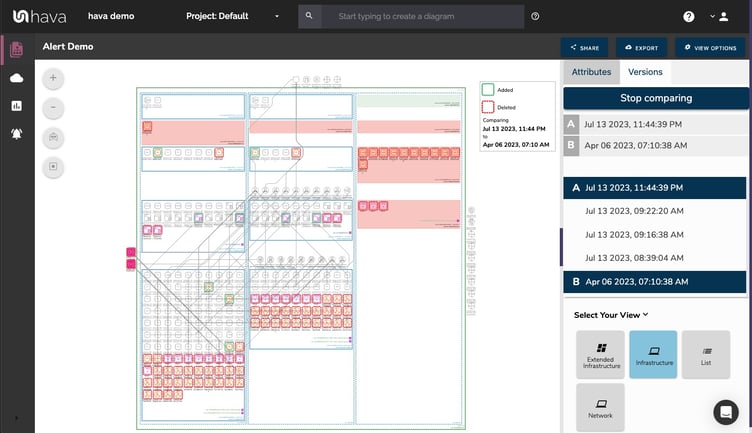
Visualizing cloud architecture through diagrams is paramount for cloud architects and engineers. Firstly, it provides a clear and concise overview of the entire cloud ecosystem, allowing for better comprehension of the infrastructure's intricacies. This visualization aids in identifying potential bottlenecks, vulnerabilities, or inefficiencies that might otherwise go unnoticed.
Moreover, as cloud environments grow in complexity, with multi-tier applications and interdependent services, a well-structured diagram becomes an invaluable tool for troubleshooting and performance optimization. It also facilitates effective communication among cross-functional teams, ensuring that developers, operations, and even business stakeholders are aligned in their understanding.
Furthermore, when planning migrations, expansions, or integrations, having a visual representation of the current state can guide decision-making, ensuring seamless transitions and robust system design. In essence, visualizing cloud architecture is a proactive approach to maintain system resilience, scalability, and operational excellence in the ever-evolving cloud landscape.

Amazon Web Services (AWS) stands as a titan in the realm of cloud computing, offering a vast array of services and solutions that cater to diverse business needs. Launched in 2006, AWS has since revolutionized the way organizations approach IT infrastructure, providing scalable, reliable, and cost-effective cloud resources.
At the heart of AWS lies its global infrastructure, comprising numerous data centers spread across geographic regions and availability zones. This design ensures high availability, fault tolerance, and data redundancy. Key components include:
AWS boasts a comprehensive suite of services that span computing, storage, databases, machine learning, analytics, and more. Some of the flagship services include:
As businesses continue to migrate to the cloud, AWS remains a preferred choice for many, given its robust infrastructure, wide range of services, and commitment to innovation. Whether startups or Fortune 500 companies, AWS provides the tools and services to build and scale applications with unparalleled flexibility and reliability.
Hava.io supports AWS cloud architecture diagrams.
Microsoft Azure, often simply referred to as Azure, is Microsoft's flagship cloud computing platform, offering a diverse set of services and tools that empower businesses to achieve more in the digital age. Launched in 2010, Azure has rapidly grown to become one of the leading cloud platforms, known for its integration capabilities, hybrid cloud solutions, and a vast array of services tailored for various industries.
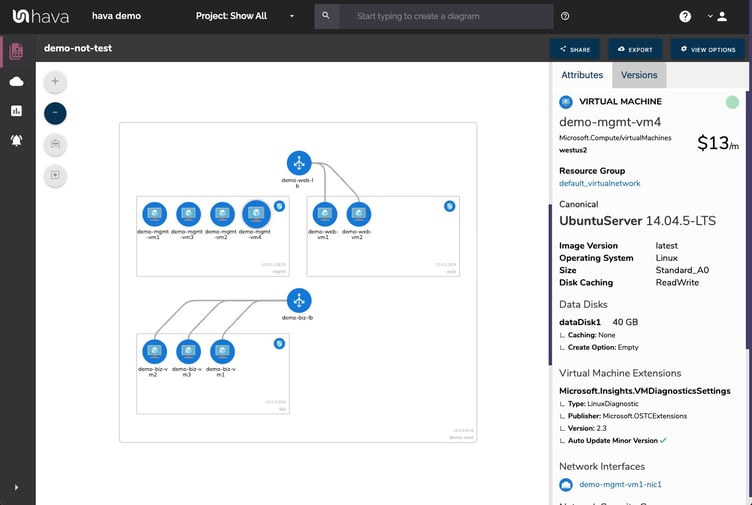
Azure's infrastructure is globally distributed, with data centers located in multiple regions worldwide, ensuring resilience, scalability, and a broad reach. Key architectural components include:
Azure provides a comprehensive suite of services that cater to computing, storage, AI, databases, and beyond. Some of the standout services encompass:
Azure's commitment to innovation, combined with its emphasis on security, compliance, and hybrid capabilities, makes it a top choice for businesses of all sizes. From startups to global enterprises, Azure offers the flexibility and tools necessary to build, deploy, and manage applications seamlessly across a global network of data centers.
Hava.io supports Azure Cloud Architecture Diagrams
Google Cloud Platform, commonly known as GCP, is Google's robust cloud offering, bringing the power of Google's technology stack to businesses worldwide. Launched in 2011, GCP has carved a niche for itself with its data analytics, machine learning capabilities, and open-source technologies, catering to a diverse range of industries and use cases.
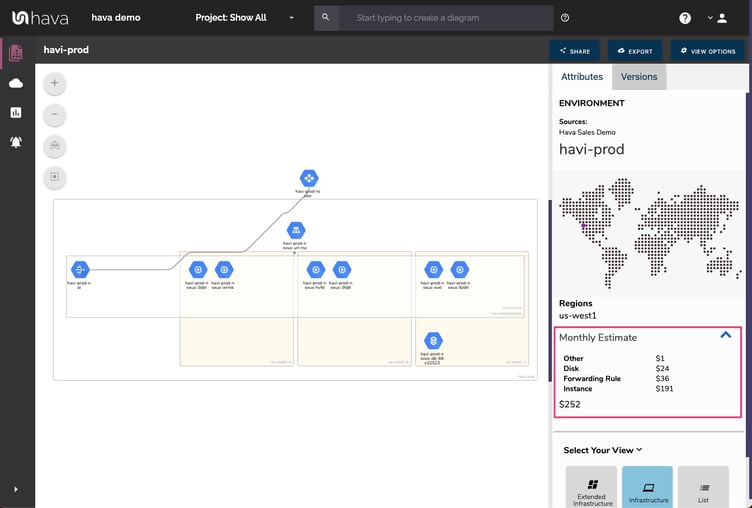
GCP's infrastructure is designed with scalability, reliability, and global reach in mind. It boasts a network of data centers spread across various regions, ensuring optimal performance and data security. Key architectural elements include:
GCP offers a wide array of services tailored for computing, storage, big data, machine learning, and more. Some of its flagship services are:
GCP's emphasis on innovation, combined with its commitment to open source and sustainability, positions it as a preferred choice for many businesses. Whether it's startups aiming for rapid growth or established enterprises seeking digital transformation, GCP provides the tools and services to harness the power of the cloud effectively and efficiently.
Hava.io supports GCP architecture diagrams.
The use of standard symbols and icons is paramount to ensuring clarity, consistency, and effective communication. These visual elements act as a universal language, enabling stakeholders from various backgrounds to understand the intricacies of cloud infrastructure without ambiguity. Here are some best practices for using standard symbols and icons:
Each major cloud provider, be it AWS, Azure, or GCP, offers its own set of official icons representing their services and resources. Utilizing these standardized icons ensures that your diagrams are instantly recognizable and aligned with industry norms.
Whether you're creating multiple diagrams for a single project or across different projects, maintaining a consistent iconography ensures that your audience doesn't face confusion. Stick to a specific style and scale for all icons, ensuring uniformity.
While icons convey the type of service or resource, colors can add an additional layer of information. For instance, different colors can denote different environments, subnets, availability zones or indicate the health status of a resource.
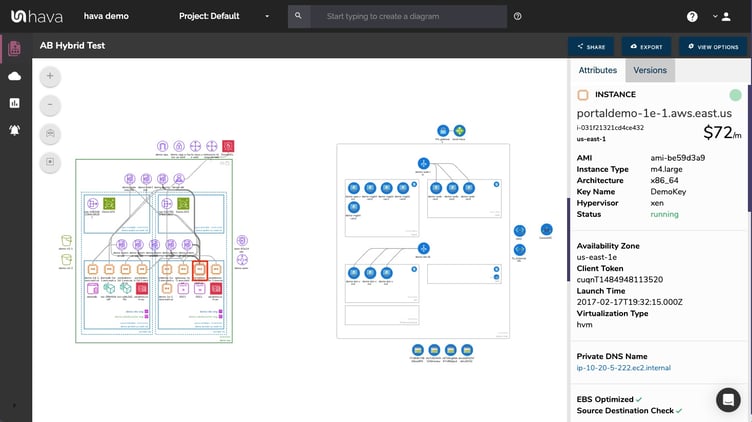
Especially for complex diagrams or those intended for a broader audience, always include a legend. This key should clearly define each symbol or icon used, ensuring that even those unfamiliar with specific cloud services can comprehend the diagram.
While it's essential to represent all critical components, avoid the temptation to include every minor detail. Overcrowding a diagram with too many icons can make it challenging to decipher. Instead, focus on clarity and simplicity, breaking down complex architectures into multiple interconnected diagrams if necessary.
Cloud services and technologies are continually evolving, with providers frequently introducing new services and updating existing ones. Regularly check for updates to the official icon sets and incorporate any changes into your diagrams.
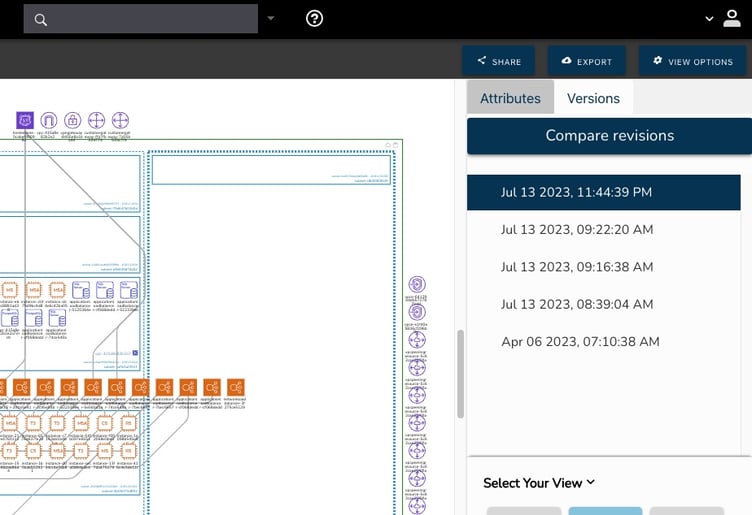
Layering and segmentation are foundational principles in cloud architecture diagramming, ensuring that complex infrastructures are presented in an organized, comprehensible manner. By categorizing and separating different components and functionalities, these techniques enhance clarity, facilitate understanding, and streamline the design process. Here are some best practices for employing layering and segmentation in your diagrams:
Group related components based on their primary function. For instance, all database services can be in one layer, while compute resources occupy another. This approach allows viewers to quickly identify and understand the role of each segment in the overall architecture.
Horizontal layers might represent different tiers of your application, such as presentation, business logic, and data storage which more often than not are segmented into different subnets. Vertical segmentation, on the other hand, can be used to differentiate between environments like geo location or availability zones
Place the most crucial or central components in prominent positions, ensuring they are easily identifiable. Peripheral or auxiliary services can be positioned towards the edges or in secondary layers. In most cases secondary components like network interface cards that would otherwise flood a diagram can be left off the diagrams but be show in a separate resource list view.
Distinguish between resources within your cloud environment and external services or integrations. This distinction helps in understanding data flow, dependencies, and potential security considerations.
Each layer or segment should have a clear boundary, preferably with labels or titles that succinctly describe its contents. This practice ensures that even at a glance, the viewer can grasp the structure of the diagram.
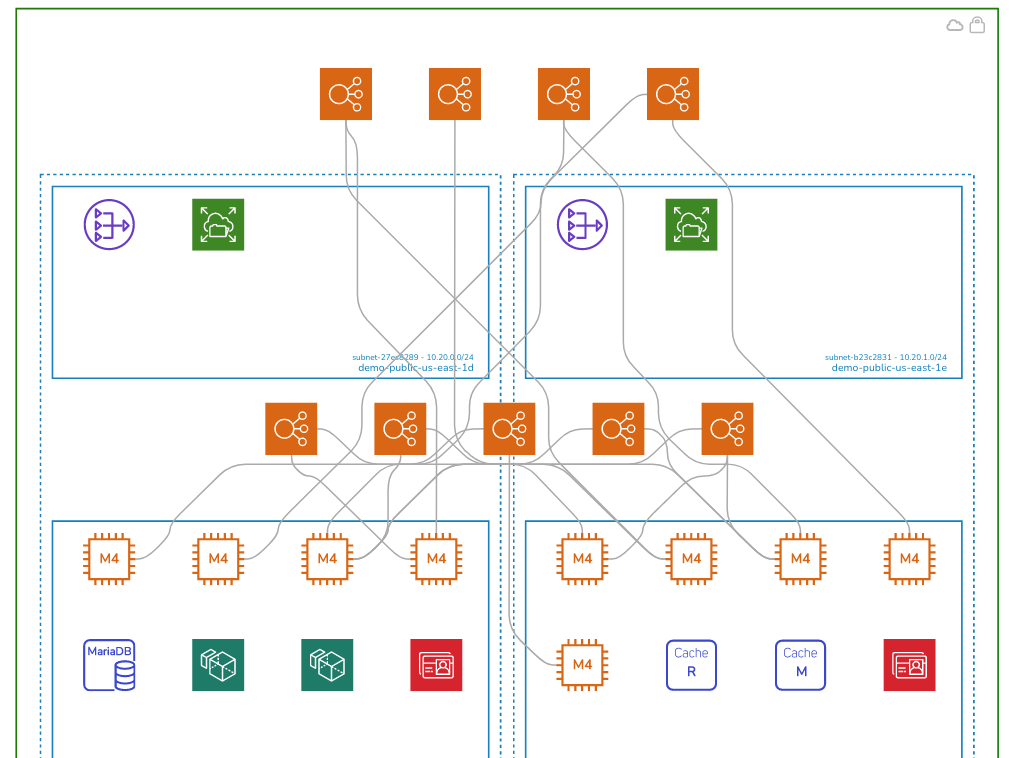
While layering and segmentation aim to separate components, it's essential to indicate interactions and dependencies between them. Use arrows, lines, or other connectors to show how different layers or segments communicate and rely on each other.
As your cloud infrastructure evolves, so should your diagrams. Regularly revisit and adjust your layers and segments to reflect changes, ensuring that your diagrams remain accurate and up-to-date.
So we've established the benefits of a well laid out cloud architecture diagram. The biggest hurdle to overcome manual processes in cloud diagramming can be cumbersome, error-prone, and inefficient. Enter Hava.io, a cutting-edge solution that brings automation to the forefront of cloud architecture visualization. By harnessing the power of Hava.io, businesses can transcend traditional diagramming limitations and unlock a plethora of benefits.
Automated Visualization: Gone are the days of manually drawing out each component. Hava.io automatically generates diagrams based on your actual cloud environment, ensuring accuracy and real-time representation.
Real-time Updates: As your cloud infrastructure evolves, so do your diagrams. Hava.io continuously monitors changes, updating diagrams instantaneously, ensuring they always reflect the current state of your environment.
Security and Compliance: With Hava.io, not only are your diagrams kept up-to-date, but they also highlight potential security risks, helping teams address vulnerabilities proactively.
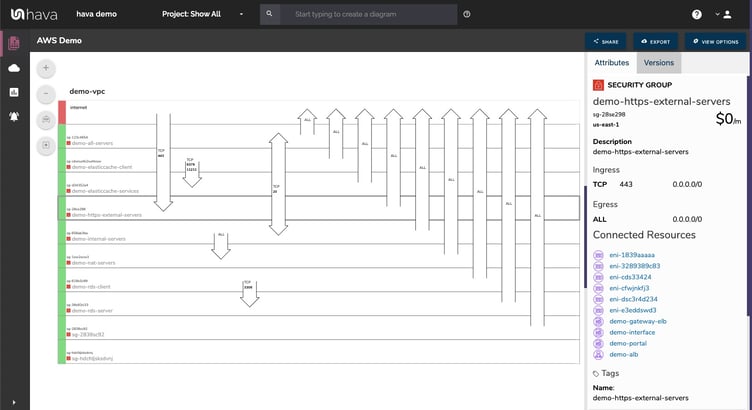
Hava.io isn't limited to a single cloud provider. It seamlessly integrates with major platforms like AWS, Azure, and GCP, offering a unified view of multi-cloud environments. This holistic approach ensures that no component is overlooked, regardless of its residing platform.
Hava even connects to cloud native and stand alone Kubernetes clusters to visualise the health of the tasks, pods and clusters.
Efficiency: Automation drastically reduces the time and effort required to create and maintain diagrams.
Accuracy: Automated diagrams are derived from real cloud configurations, eliminating human error and ensuring precise representations.
Scalability: As your cloud environment grows, Hava.io effortlessly scales with it, accommodating even the most complex architectures.
Collaboration: Shareable and interactive diagrams foster collaboration, allowing teams to work together seamlessly, whether they're in the same room or across the globe.
Integration: Use Hava's API, CLI and many plug ins and integrations to place diagram where you work and control the generation and capture of diagrams within your pipelines.

The role of cloud diagramming is evolving at an unprecedented pace. The increasing complexity of cloud environments, coupled with the demand for agility and scalability, underscores the need for advanced diagramming solutions like Hava that can keep pace with these changes.
The future of cloud diagramming is intrinsically tied to automation. Manual processes, while valuable in the early days of cloud adoption, are no longer sustainable in the face of sprawling multi-cloud architectures and rapid deployment cycles. Automation ensures real-time, accurate, and dynamic representations of cloud environments, eliminating the inefficiencies and inaccuracies inherent in manual diagramming.
Furthermore, the integration of artificial intelligence and machine learning into diagramming tools will usher in a new wave of capabilities. Predictive analytics could forecast potential infrastructure challenges, while intelligent algorithms might suggest optimization strategies, enhancing performance and cost-efficiency.
Collaboration will also be a cornerstone of next-generation cloud diagramming. As remote work becomes the norm and teams become more distributed, cloud diagrams will evolve into collaborative platforms, allowing stakeholders to interact, annotate, and make decisions in real-time.
Lastly, as sustainability and eco-consciousness gain traction, future cloud diagramming tools might also provide insights into the environmental impact of cloud infrastructures, guiding organizations towards greener cloud strategies.
In essence, the future of cloud diagramming is not just about visual representation; it's about harnessing the power of technology to drive informed decision-making, optimize cloud strategies, and foster innovation. As we move forward, it's clear that cloud diagramming will remain an indispensable tool, evolving in tandem with the ever-changing cloud landscape.
While some of these capabilities are just over the horizon, Hava answers a lot of the questions around documenting cloud architecture and is available right now. Questions like:
1. Q: How can I automatically generate cloud architecture diagrams? A: Use Hava.io for automated and real-time visualization of your cloud infrastructure. Get answers in minutes.
2. Q: What's the best tool for visualizing multi-cloud environments? A: Hava.io seamlessly integrates with major platforms like AWS, Azure, and GCP, offering a unified view of multi-cloud environments.
3. Q: How can I ensure my cloud diagrams are always up-to-date? A: With Hava.io's continuous monitoring and automatic updates, your diagrams will always reflect the current state of your environment.
4. Q: Is there a tool that highlights security vulnerabilities in my cloud architecture diagrams? A: Yes, Hava.io not only visualizes your cloud setup but also highlights potential security risks, aiding in proactive risk management for AWS and Azure deployments.
5. Q: How can I improve collaboration among my team with cloud diagrams? A: Hava.io provides shareable and interactive diagrams, fostering seamless collaboration among team members. Integrations such as a Confluence plug in make sharing this information a breeze.
6. Q: Can I get a holistic view of my entire cloud ecosystem in one diagram? A: Absolutely! Hava.io offers a comprehensive view of your entire cloud infrastructure, ensuring no component is overlooked. When you are utilising multiple cloud vendors, Hava's custom diagram view allows you to place environments from multiple vendors on the same diagram.
7. Q: How do I reduce the time spent on manual diagramming? A: Switch to Hava.io for automated cloud diagramming, drastically reducing the time and effort required. In just a couple of minutes you can create read only credentials, connect to Hava and have your diagrams, no matter how many VPCs or virtual networks you have configured.
8. Q: Is there a cloud diagramming tool that integrates AWS Well Architected suggestions? A: Hava's AWS Compliance advanced features can guide you towards best practices and optimization strategies for your AWS cloud environment. It will show you where your configuration can be improved and any critical issues that you need to address.
9. Q: How can I visualize the data flow in my cloud architecture? A: Hava.io's intuitive diagrams provide clear indications of data flow, interactions, and dependencies within your cloud setup. Optionally viewed connections show the pathways through your architcture.
10. Q: Can I get a tool that scales with my growing cloud infrastructure? A: Hava.io is designed to effortlessly scale with your cloud environment, accommodating even the most complex architectures. The monitoring alerts built in
11. Q: How do I ensure consistency in my cloud diagrams across projects? A: By using Hava.io, you can maintain a consistent iconography and style across all diagrams, ensuring uniformity and clarity.
12. Q: Is there a way to get insights into the cost-efficiency of my cloud setup through diagrams? A: Hava.io's detailed diagrams can guide you in understanding resource allocation, helping you make informed decisions for cost-efficiency.
13. Q: How can I visualize containerized components in my cloud diagrams? A: Hava.io offers comprehensive visualization, including container workloads, ensuring a complete representation of your cloud architecture.
14. Q: Can I get real-time alerts on changes to my cloud infrastructure in my diagrams? A: With Hava.io's continuous monitoring, any changes to your cloud infrastructure are instantly reflected in your diagrams, keeping you always informed. Optionally you can receive email alerts when your cloud architecture changes including a Diff diagram.
15. Q: How do I transition from manual to automated cloud diagramming? A: Making the switch is easy with Hava.io. Its user-friendly interface and automated features ensure a smooth transition from manual to automated diagramming.
16. Q: How can I view architecture changes between two dates? A: Using the versioning tab in Hava, you can select any two diagrams and run a revision comparison query that will return a diff diagram showing you all the changes. This can be your live cloud architecture vs a diagram from yesterday (handy for identifying the cause of outages or app errors) or you could compare today to the same point last year to give compliance auditors what they typically want to know.
Diagramming your AWS or Azure Cloud security posture is always a good idea and can highlight vulnerabilities that are hard to spot using just your...
Explore how automated diagramming with Hava enhances multi-cloud management across AWS, Azure and GCP for better visibility and compliance.
You can now deploy hava.io on your own cloud infrastructure. If you have security or governance policies preventing access to your cloud networks,...