Cloud network security diagrams are a visual representation of an organization's cloud infrastructure that provides an overview of the security and data protection measures in place. In today's digital age, where cloud computing has become the norm for many organizations, it is crucial to have a secure and protected cloud environment.
Monitoring your cloud infrastructure is a critical aspect of ensuring the security of your data and systems, and a cloud network security diagram is an essential tool in achieving this goal.
The primary purpose of a cloud network security diagram is to help organizations understand the different components of their cloud infrastructure and how they are interconnected. This understanding is crucial when it comes to identifying potential security risks and vulnerabilities. With a cloud network security diagram, organizations can see how their systems are protected, what security measures are in place, and how to improve their security posture.
One of the key benefits of a cloud network security diagram is that it allows organizations to monitor their cloud infrastructure in real-time. This means that organizations can quickly review their current running infrastructure and identify any potential security threats and take action to mitigate them. The diagram also helps organizations to identify any misconfigurations that may lead to security breaches like open ports or protocols allowing access into VPCs containing sensitive data, allowing them to make changes to their cloud infrastructure security before a breach occurs.
Another benefit of cloud network security diagrams is that they provide organizations with a clear understanding of their cloud infrastructure. This includes the different types of cloud services being used, the data that is being stored in the cloud, and the different security measures that are in place. This information is essential for organizations to understand their security posture and to identify areas that may need improvement.
The important element of this process is visualizing your security groups and the relationship to running infrastructure resources. Hava’s security view for instance is generated automatically alongside the infrastructure view, giving you a helicopter view of what you have running and how it is secured without evr having to open your cloud console.
The use of cloud network security diagrams also enables organizations to implement a proactive security strategy. This means that organizations can identify potential security risks and vulnerabilities before they become an issue. This proactive approach can help organizations to avoid costly security breaches, as well as minimize the impact of any security incidents that do occur. Trying to address security issues after your data has been harvested and published on the dark web is never a good look.
When creating a cloud network security diagram, it is important to ensure that it accurately represents the organization's cloud infrastructure. This includes including all relevant components, such as cloud services, firewalls, virtual private networks (VPNs), and security posture. The diagram should also be updated regularly to ensure that it remains accurate and relevant.
When you have Hava connected to your cloud accounts, this is 100% automated. Once you connect, your infrastructure and security diagrams are auto generated to reflect EXACTLY what is running in your cloud console and then auto updated every time a change is detected, hands free, no manual sync or intervention needed, even if you haven’t logged in.
Finally, it is important to note that cloud network security diagrams should be used in conjunction with other security tools and measures. For example, organizations should also be using firewalls, intrusion detection systems, and antivirus software, to protect their cloud infrastructure. In addition, regular security audits and risk assessments should also be carried out to ensure that the cloud infrastructure remains secure. Making the Hava security view available to your security team puts them on the front foot, giving them a visual representation of what is running and how it is facilitating traffic ingress and egress. Valuable information that will fast track issue resolution that would otherwise be difficult to decipher in the console settings
Why document your security stance? Cloud network security diagrams are a valuable tool for organizations looking to monitor their cloud infrastructure. They provide organizations with a clear understanding of their security posture, allow them to identify potential security risks, and enable organizations to implement a proactive security strategy. By using Hava cloud network security diagrams, organizations can ensure the security and protection of their data and systems, demonstrate to stakeholders that your security is on-point and can also help you minimize the impact of any security incidents that do occur.
Hava auto generates security diagrams for both AWS and Azure automatically.
The AWS security view displays all the known security groups with the open ports overlaid on the diagram as arrows indicating the protocol, port number and ingress/egress points.
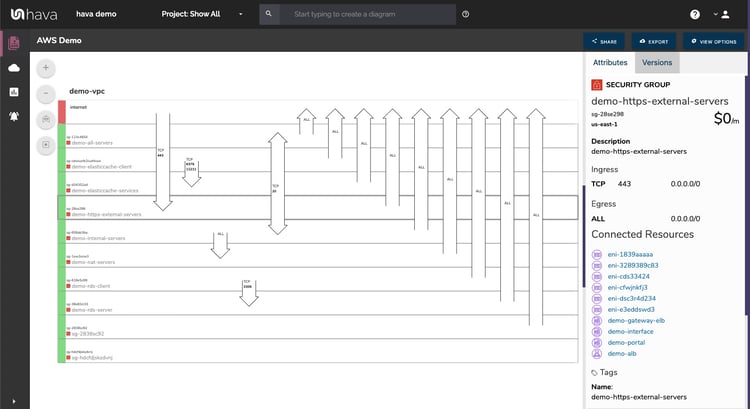
The diagram is interactive, meaning you can select an element like an individual security group and all the known metadata like the connected resources will be shown in the attribute pane to the right of the diagram.
You can export your diagrams for offsite storage or inclusion in management reports and you can embed live diagrams externally in places like a confluence Wiki, intranet web property, Jira ticket to allow team members who don’t have Hava access the ability to view and interact with diagrams.
The Azure security view layout is slightly different with the security groups represented in columns and the connection points shown on the left of the diagram.
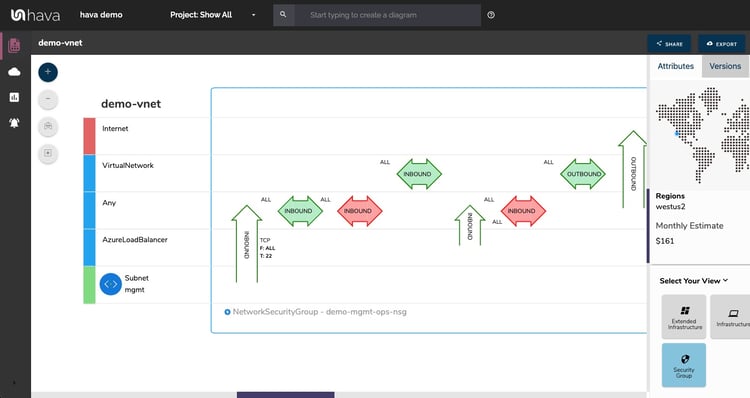
The horizontal arrows represent port and protocols, while the vertical arrows show traffic flow ingress and egress points.
With a Network Security Group selected on the diagram the attribute pane to the side of the diagram will show :
- NSG Name
- Region
- Provisioning State
- Inbound Rules
- Outbound Rules
- Connected Network Interfaces
- Connected Subnets
You can view your current AWS or Azure network security posture by simply connecting your cloud account to Hava and letting the application do the heavy lifting and generate the security view for you,
While Hava has CyberGRX certification and SOC2 type 2, if your internal governance or security policies prevent connecting your cloud accounts to a third party SaaS, you can run Hava in a self hosted container on your own infrastructure. This means all the data related to the diagrams remains on your infrastructure, behind your security with external connections.
On top of the security view you also get clarity on your infrastructure with clean well laid out VPC diagrams. One diagram is created for each VPC discovered and details the region, availability zones, subnets and all the discovered resources.
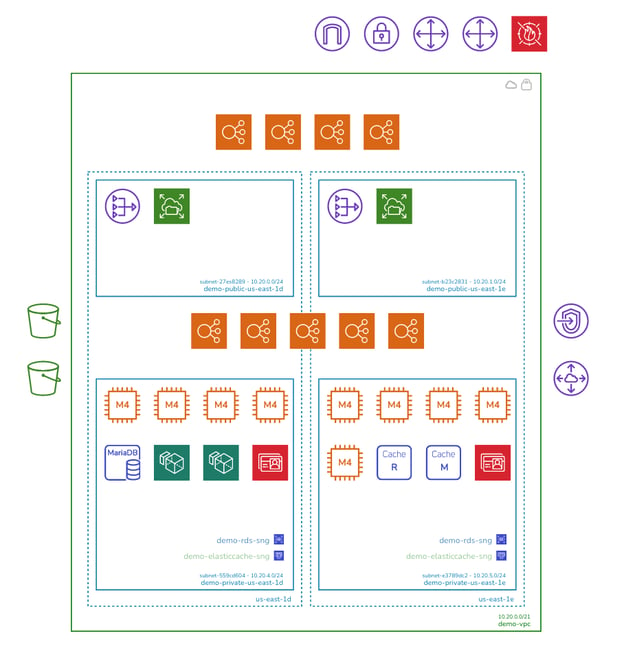
The diagrams are interactive in that when you select a resource, all the metadata and settings known about the resource are displayed in the attribute pane to the side of the diagrams :
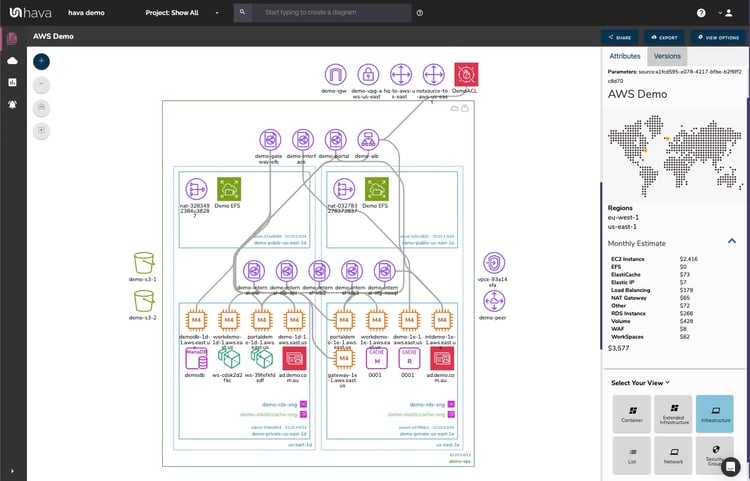
There are any number of Hava features you can leverage to make your cloud engineering life a little bit easier :
- Exports - Take diagrams out to JPG, PDF, Visio, JSON, CSV
- Embeds - Use integrations to view or generate diagrams in Confluence, GitHub, Terraform or embed anywhere with iFrame code snippets
- Versioning - compare current and historical diagrams to identify changes
- Deep Search - find anything across hundreds of cloud accounts with a single search
- Custom Diagrams - use search to create on-the-fly diagrams using tags and other resource or network attributes.
If you aren't currently using Hava to automate your cloud network diagrams you can take the fully featured teams account for a free 14 day trial and connect your actual cloud account to visualise what you have running.
If you still have questions or would like to organise a 1:1 screen share demo please get in touch.


