Hava adds Kubernetes Cluster Diagrams
The team at Hava are pleased to announce the addition of stand alone Kubernetes clusters to the supported data sources used by Hava to visualise cloud infrastructure. Up until today, you needed to connect either an AWS, Azure or GCP account (data source) which Hava would scan and automatically generate network topology, security and container diagrams.
The Kube import feature is now available as a private Beta. Please get in touch if you would like access.

Hava has supported AWS ECS cluster diagrams known as container views for some time, but with this release introduces stand alone K8 cluster support.
With this new addition, you can connect any K8 cluster to Hava using a generated configuration file. Hava will then scan the cluster and visualise the cluster and running pods giving you a visualisation of your containerised workloads.
One of the major benefits of visualising your containers, services and tasks or pods is you can see at a glance the operational status of your workloads. Hava uses hexagonal icons to represent tasks and color codes them depending on their operational status. This means at a glance you can see any tasks that are not running properly.
Connecting Kubernetes Clusters to Hava.
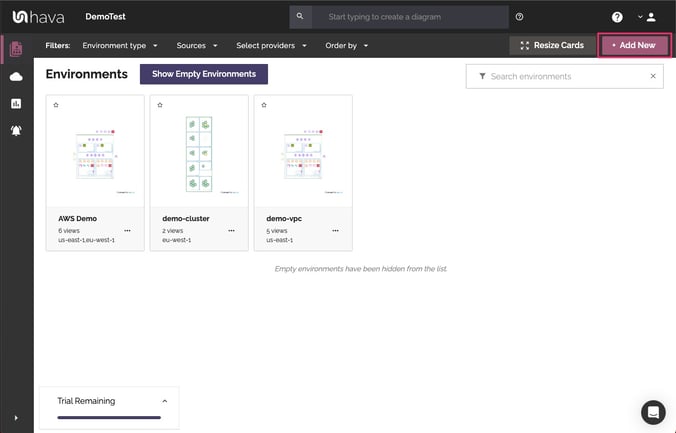
Connecting your Kubernetes cluster to Hava starts at the same place you would import a new AWS, GCP or Azure environment, the add environment tile in Hava's environment dashboard.
On the import an environment screen, select the Kubernetes tab.
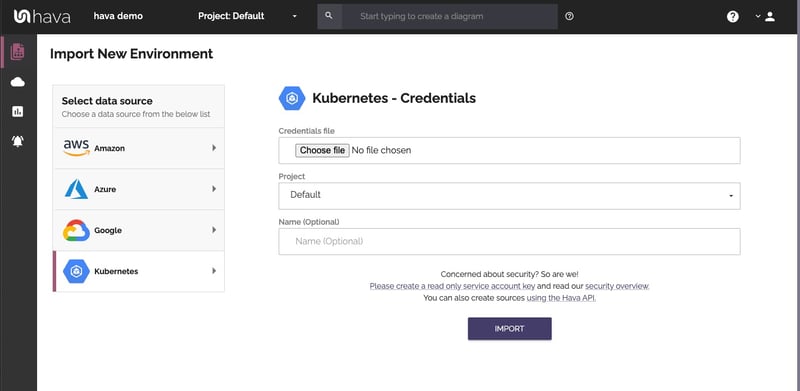
To connect to your K8 cluster you will need to import a file containing your kubeconfig. We recommend creating a new read-only service account for Hava to access your cluster.
Details on how to create the roles and kubeconfig access file see our documentation here: Read Only Kubeconfig.
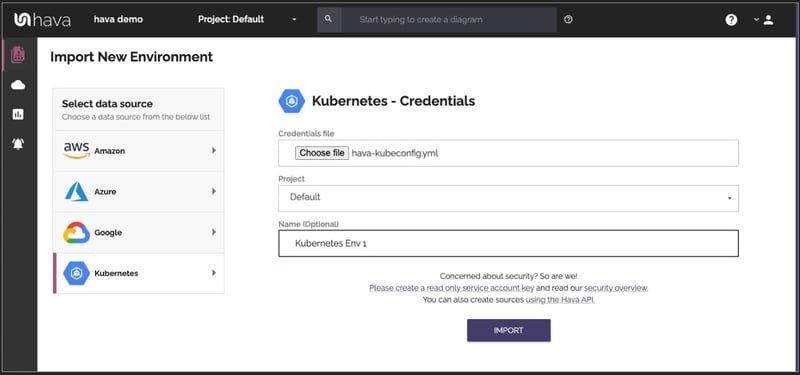
Once you have your hava-kubeconfig.yml file enter it into the import dialogue and import your cluster.
Hava will then scan your cluster and auto generate a complete visualisation of the resources detected, cluster, nodes, pods and the relationships between them.
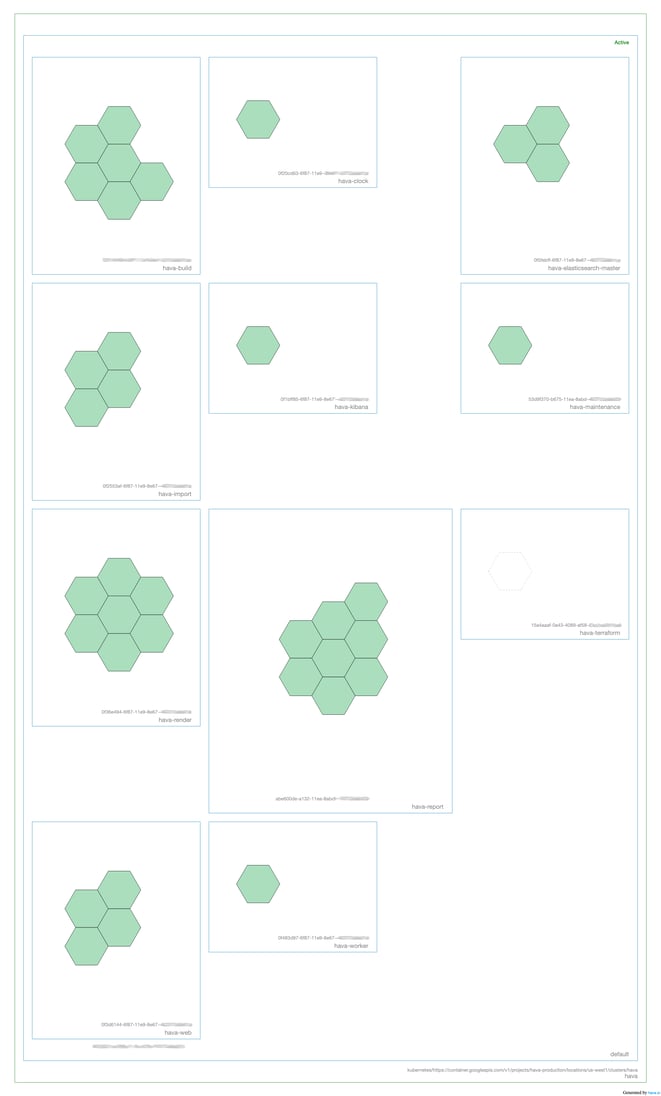 In the above example all the pods are green indicating a healthy state. As with all Hava interactive diagrams you can select a pod to see all the containers running in it, you could hover over a node in the attributes pane to highlight all the pods running on that node. The power of the visualisation is when things aren't running as expected.
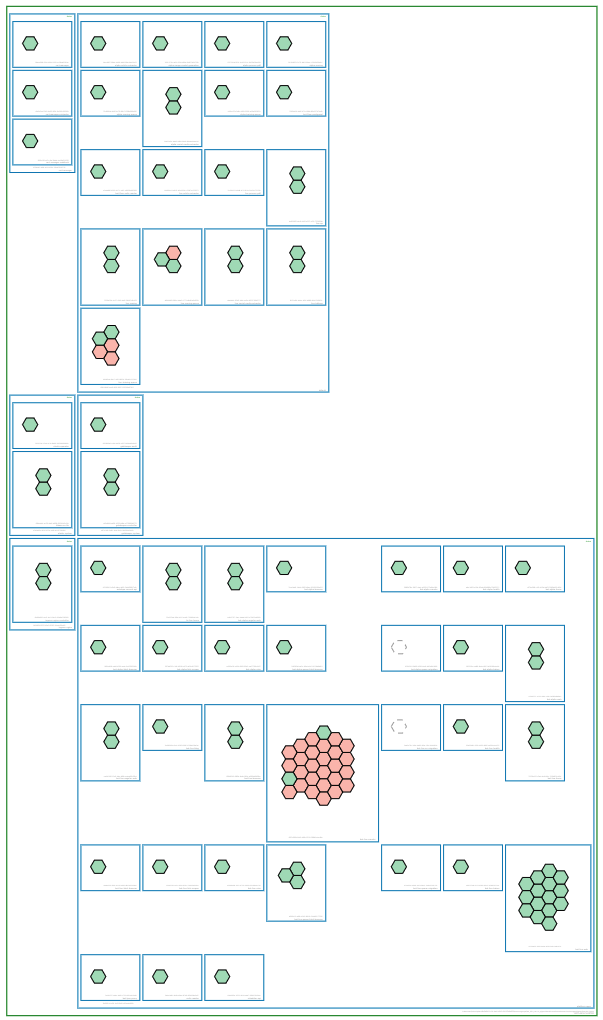
The colour of each pod indicates the run status of the workload. The green indicates healthy and running, but the red indicates a sub-optimal health status like stopped. An amber pod denotes the status is changing, so it could be starting or stopping.
By selecting a suspect pod, you are able to see the meta data in the attribute pane including the connected containers and associated nodes in the cluster so you can quickly identify what needs to be addressed in order to return the workloads to optimal health.
This feature release brings further utility to Hava for clients running stand alone K8 clusters and container workload visualisation will be further enhanced shortly with the addition of native AKS and EKS support on top of the currently supported AWS ECS container views.
If you are not already using Hava to auto generate cloud network topology diagrams and documentation from your AWS, Azure, GCP or Kubernetes deployments, you can take a free trial using the button below.