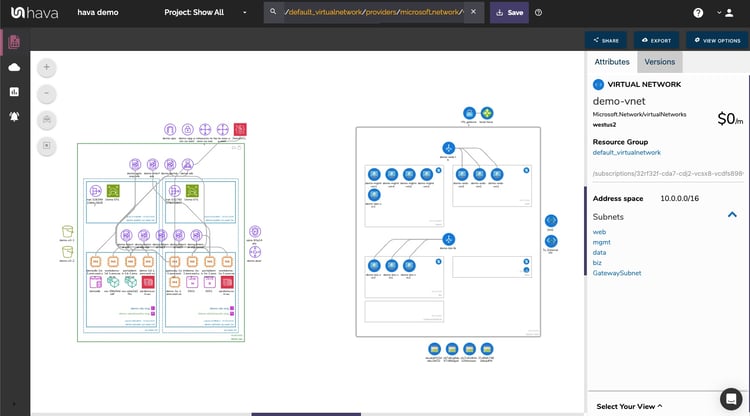
With the availability of multiple cloud platforms each with their own strengths and cost advantages, it is not uncommon for DevOps engineers and cloud architects to take advantage of resources from multiple cloud vendors when designing a cloud based application.
Professional engineers and architects understand the advantages of maintaining an accurate set of network topology diagrams once a solution is deployed so that new engineers, management and auditors can easily understand the current state of play with a project. Having the environments visualised speeds up the comprehension process at all levels and allows your team to monitor exactly what is configured and running.
Up until now, no matter how you have been producing your network diagrams, including infrastructure from AWS, GCP and Azure has been a separate process especially if you have auto generating your cloud network topology.
Hava solves this challenge by providing a 'custom query' method to instantiate diagram sets that can include infrastructure from multiple cloud providers.
Not only are you able to select multiple vendors, you can also join multiple projects or Virtual Private Clouds (VPCs) onto a single diagram set.
As with all auto generated Hava documentation, once the diagram set is saved, it will continue to be automatically updated and a fully interactive version saved every time a resource change is detected.
Let's take a look at both use cases.
Creating a multiple AWS VPC diagram
When you connect your AWS account credentials to Hava, diagrams will be created for each discovered VPC. To identify the VPC ID's of the VPCs you would like to appear on a single diagram, open each of the system generated individual VPC diagrams and get the VPC ID
Lets say in this example, we wish to combine the demo-vpc and hava-white VPCs:
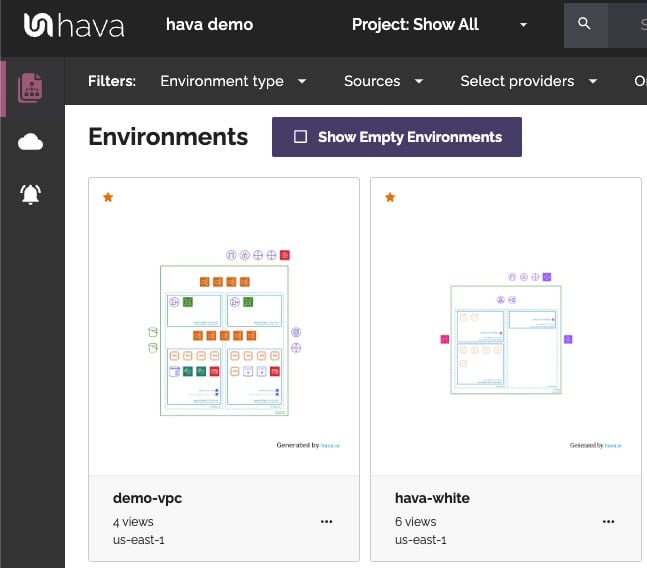
To identify the VPC IDs, we need to open up each of the diagrams in the default 'infrastructure' view and select the outer rectangle representing the VPC
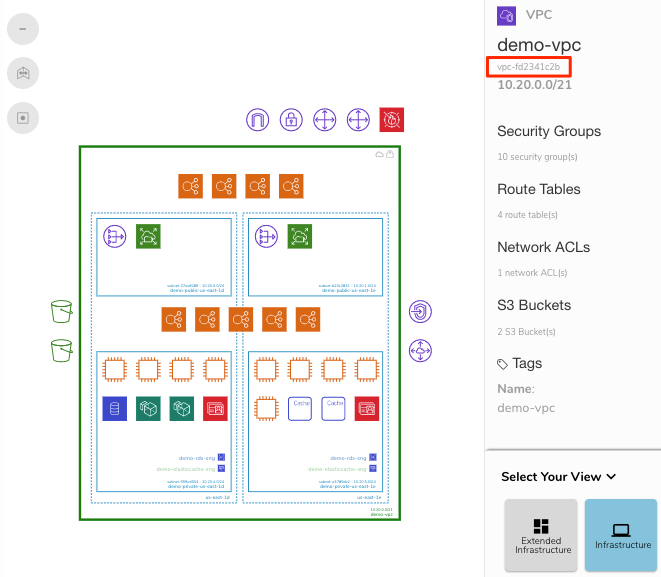
This will display the VPC attributes to the side of the diagram including the VPC ID. Note this down and repeat the process for each of the VPCs you want to include on the new custom diagram.
In this example we identify vpc-fd2341c2b and vpc-b356fbca as the target ids.
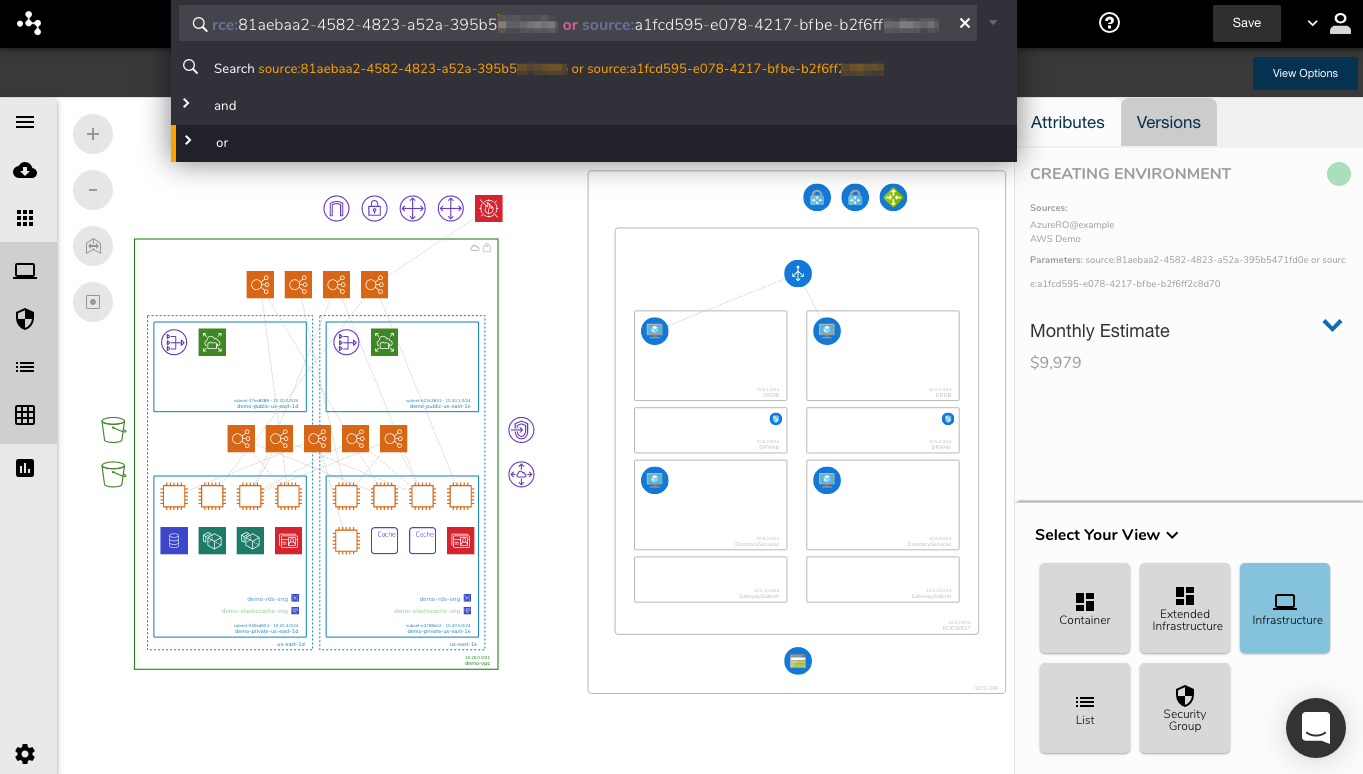
Now returning to the environments dashboard, in the custom query box in the top header bar, enter vpc: followed by the first vpc id then 'or' and the second vpc:id -
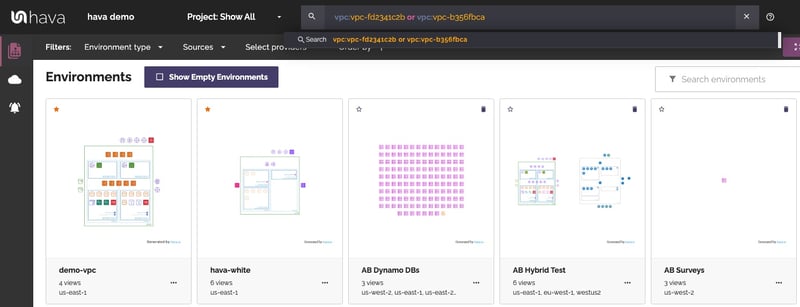
This will on-the-fly create a new diagram set that includes both VPCs on the one diagram.
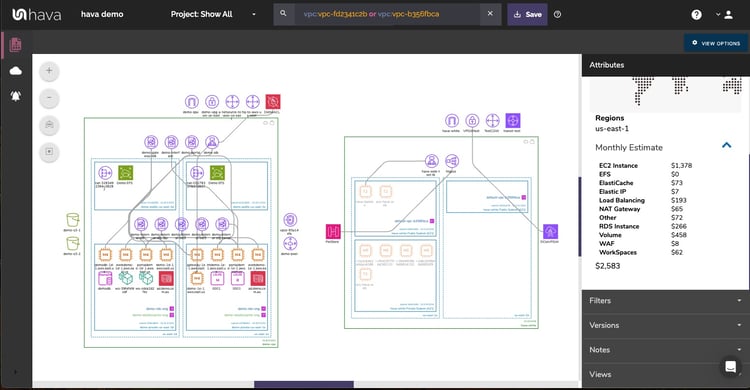
At this point the diagram is fully interactive and will have collated the estimated cost estimates onto the one diagram.
To make this diagram a permanent feature of your diagram dashboard, all you need to do is save the diagram using the save button at the top of the diagram. Once saved, Hava will keep the diagram updated and maintain a full version history every time anything changes in either of the documented VPCs
There is technically no limit to the number of VPCs you can add to a custom diagram using this method.
Creating Hybrid Cloud Diagrams
The custom query function has a whole host of options that allow you to select entire data sources down to individual resource types.
The benefit of this flexibility is the query function can be used to build single diagrams using configuration data from multiple cloud vendors.
In this example we'll look at including an Azure resource group and an AWS VPC on the same visualization.
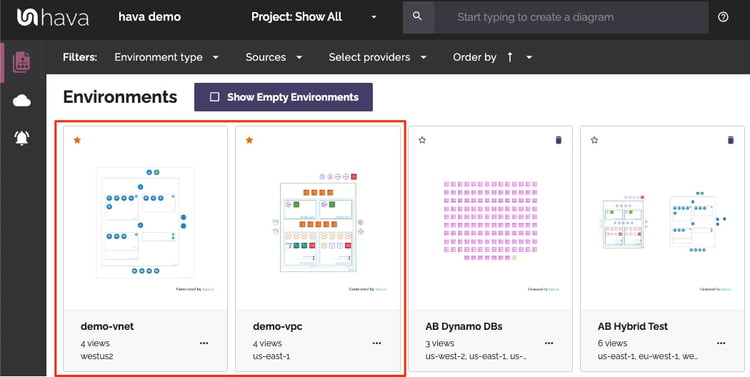
To specify the Azure resource group, the process is similar to the AWS VPC id already discussed. Open the automatically generated Azure diagram, select the outer rectangle that represents the resource group and copy the resource group id:
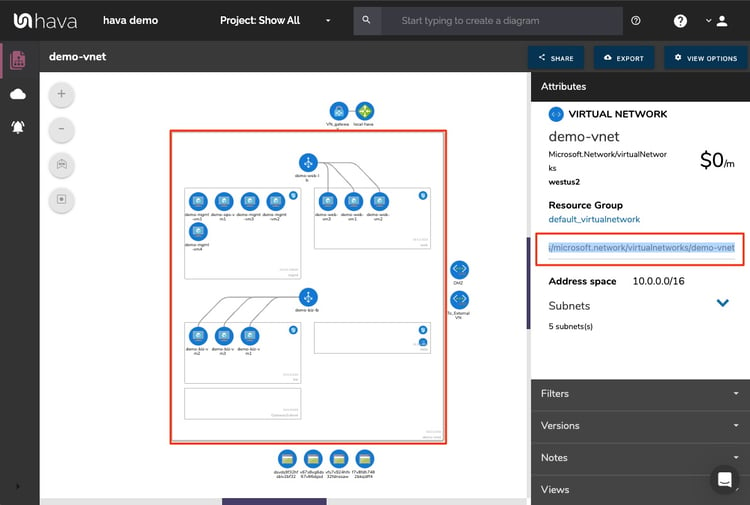
Once you have the resource id, you can use it in the query string, using the resource_group: modifier followed by the resource group id and the "or vpc:[required vpc id]
In this instance the query to build the hybrid diagram would be:

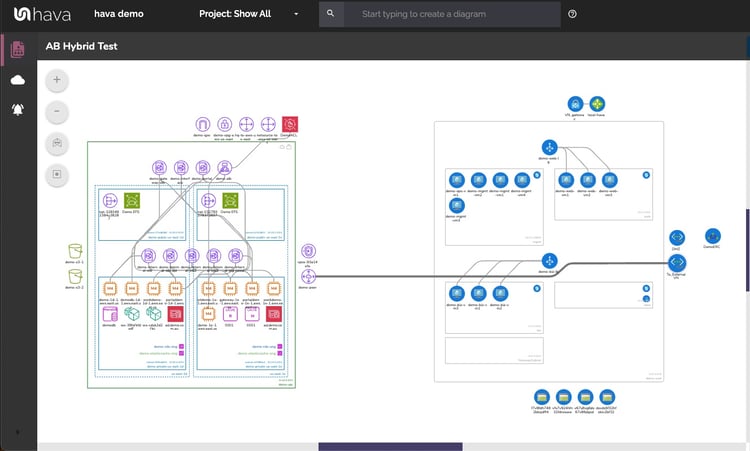
Once you save this diagram, it will continue to be synced and updated automatically and any changes captured in a version history for later interactive inspection.
There are a number of system modifiers that can be used to build custom diagrams drawing from all your connected cloud accounts. The standard modifiers are:
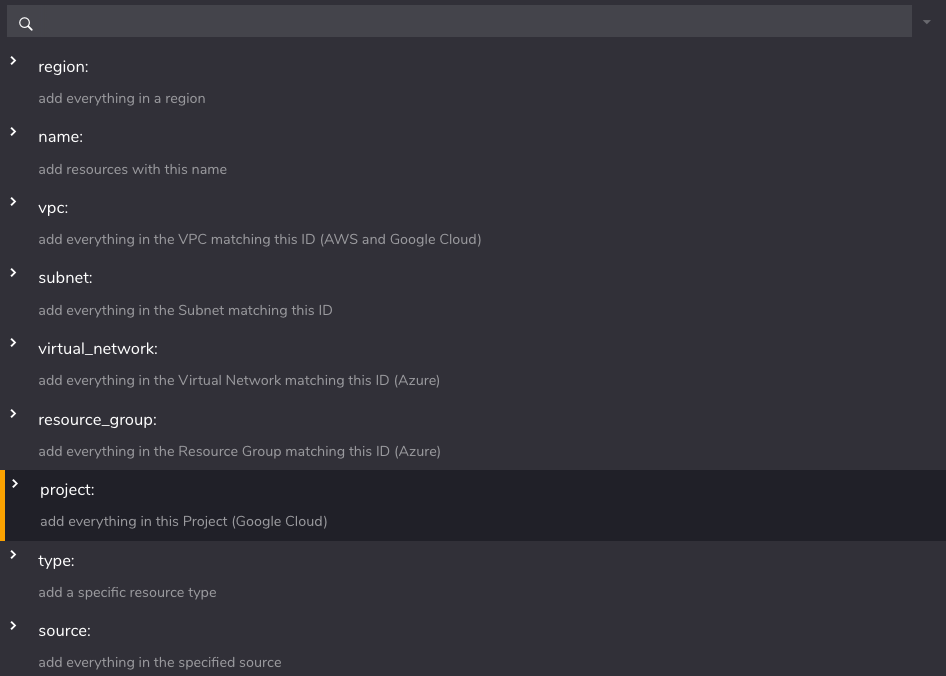
You can also specify IP address and arbitrary tags that may be present throughout your infrastructure.
This can be especially useful if you want to keep track of separate projects or departments via tags. If for instance you had a tag called 'Department' with a value of "dev", then using "Department:dev" in the custom diagram query would return all the individual resources with that custom tag.
Hava provides extremely powerful and granular control over your cloud environment documentation without resorting to time consuming and potentially inaccurate drag and drop drawing tools.
If you are already using Hava but not taking advantage of the powerful custom query functionality, please try it out or hit up chat support if you need help.
If you aren't already using hava.io to automate your cloud documentation, you can grab a 14 day free trial below, or contact us to request a demo.
See also: Cloud Computing Glossary of Terms


