5 min read
Container Service Diagram
By Alan Blackmore on July 22, 2024
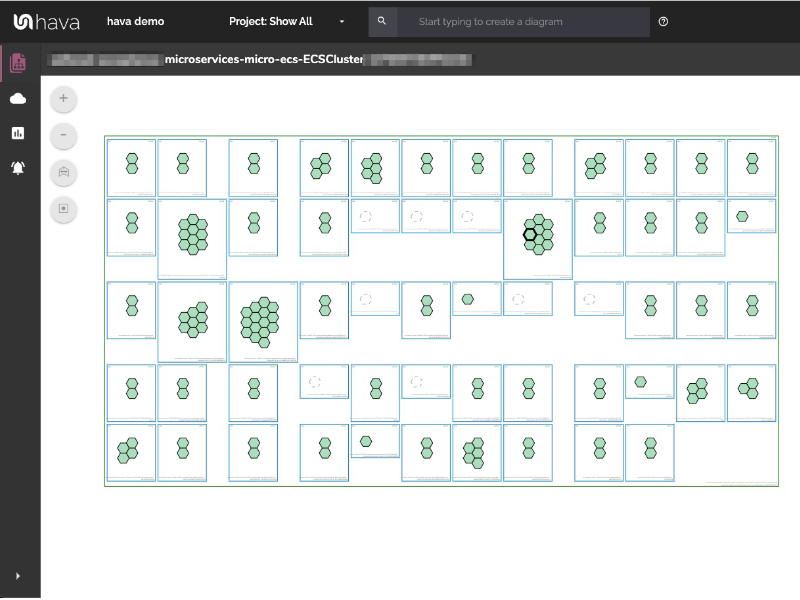
Container Service Diagram: Visualizing Workloads with Hava.io
Introduction
Topics: containers ecs eks aks gke
4 min read
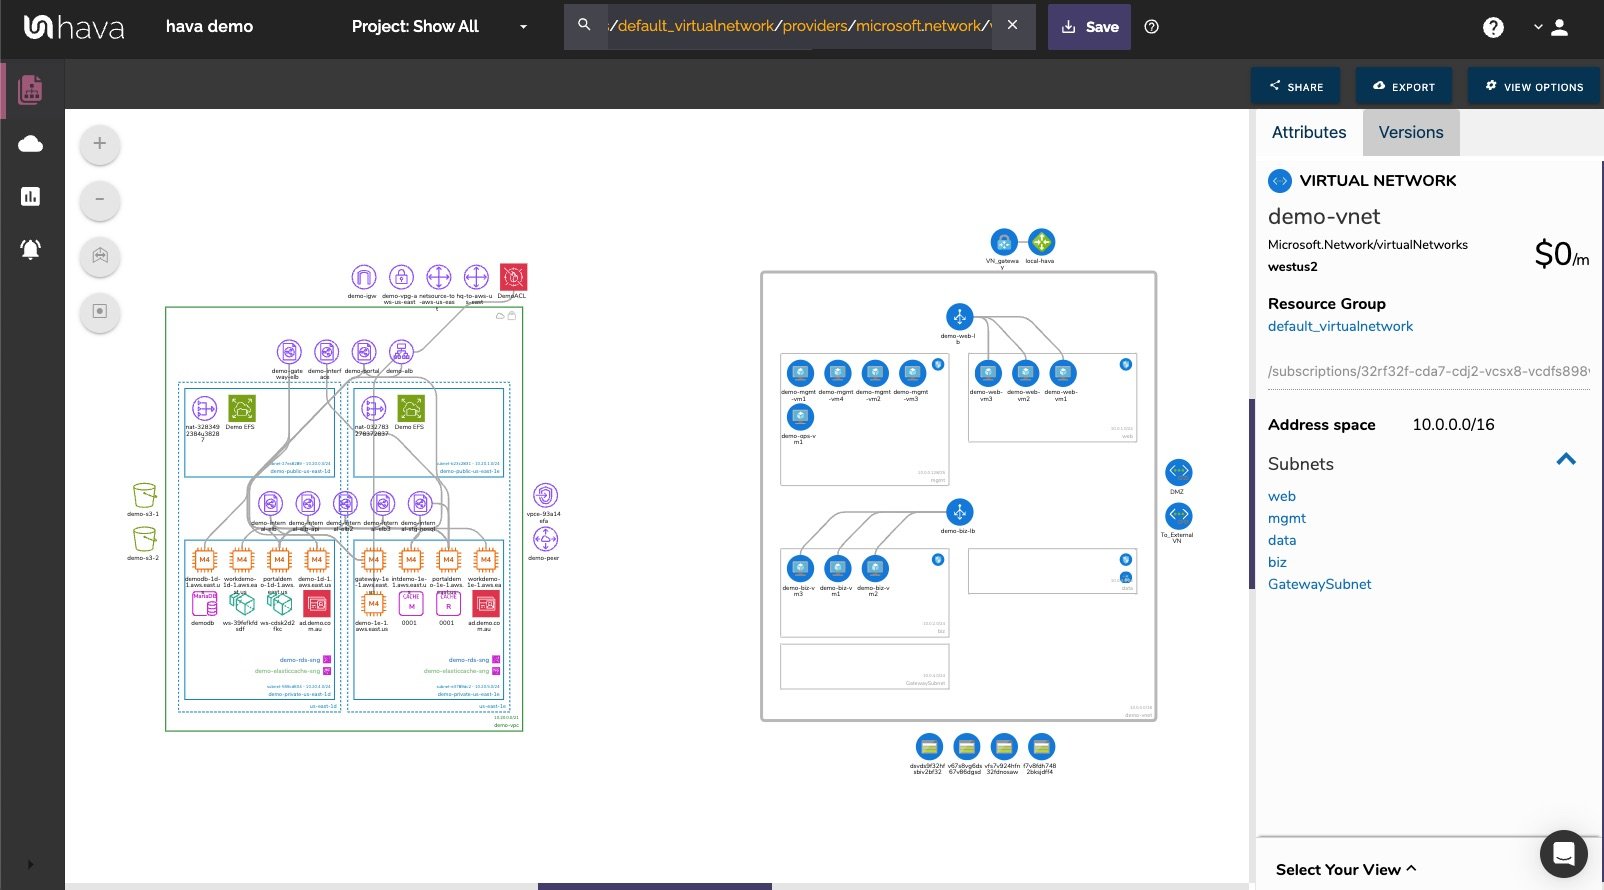
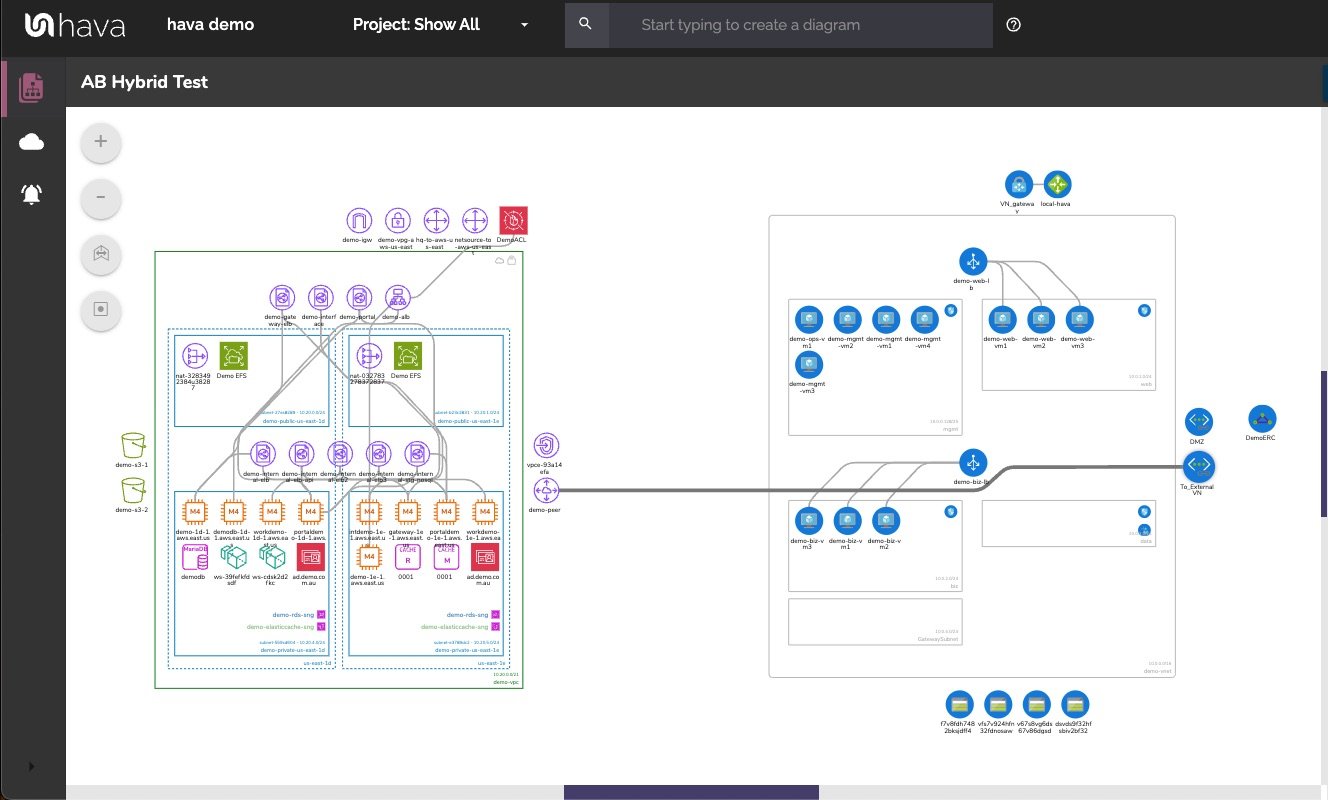
Visualizing Hybrid Cloud Architecture with Hava.io
By Alan Blackmore on July 17, 2024
Introduction
Topics: hybrid cloud
4 min read
Generating Dynamic Cloud Diagrams
By Alan Blackmore on July 8, 2024
Generating Dynamic Cloud Diagrams with Hava.io
Topics: aws azure gcp hybrid cloud
3 min read
Creating Disaster Recovery Diagrams
By Team Hava on July 1, 2024
Creating Disaster Recovery Diagrams: Ensuring Resilience with Hava.io
Topics: aws azure gcp disaster recovery
3 min read
Multi-Cloud Diagram Tools with API Integration
By Alan Blackmore on June 27, 2024
Multi-Cloud Diagram Tools with API Integration: Enhancing Capabilities with Hava.io
Topics: aws azure gcp api hybrid cloud
3 min read
Automating Multi-Cloud Diagrams with Hava
By Alan Blackmore on June 25, 2024
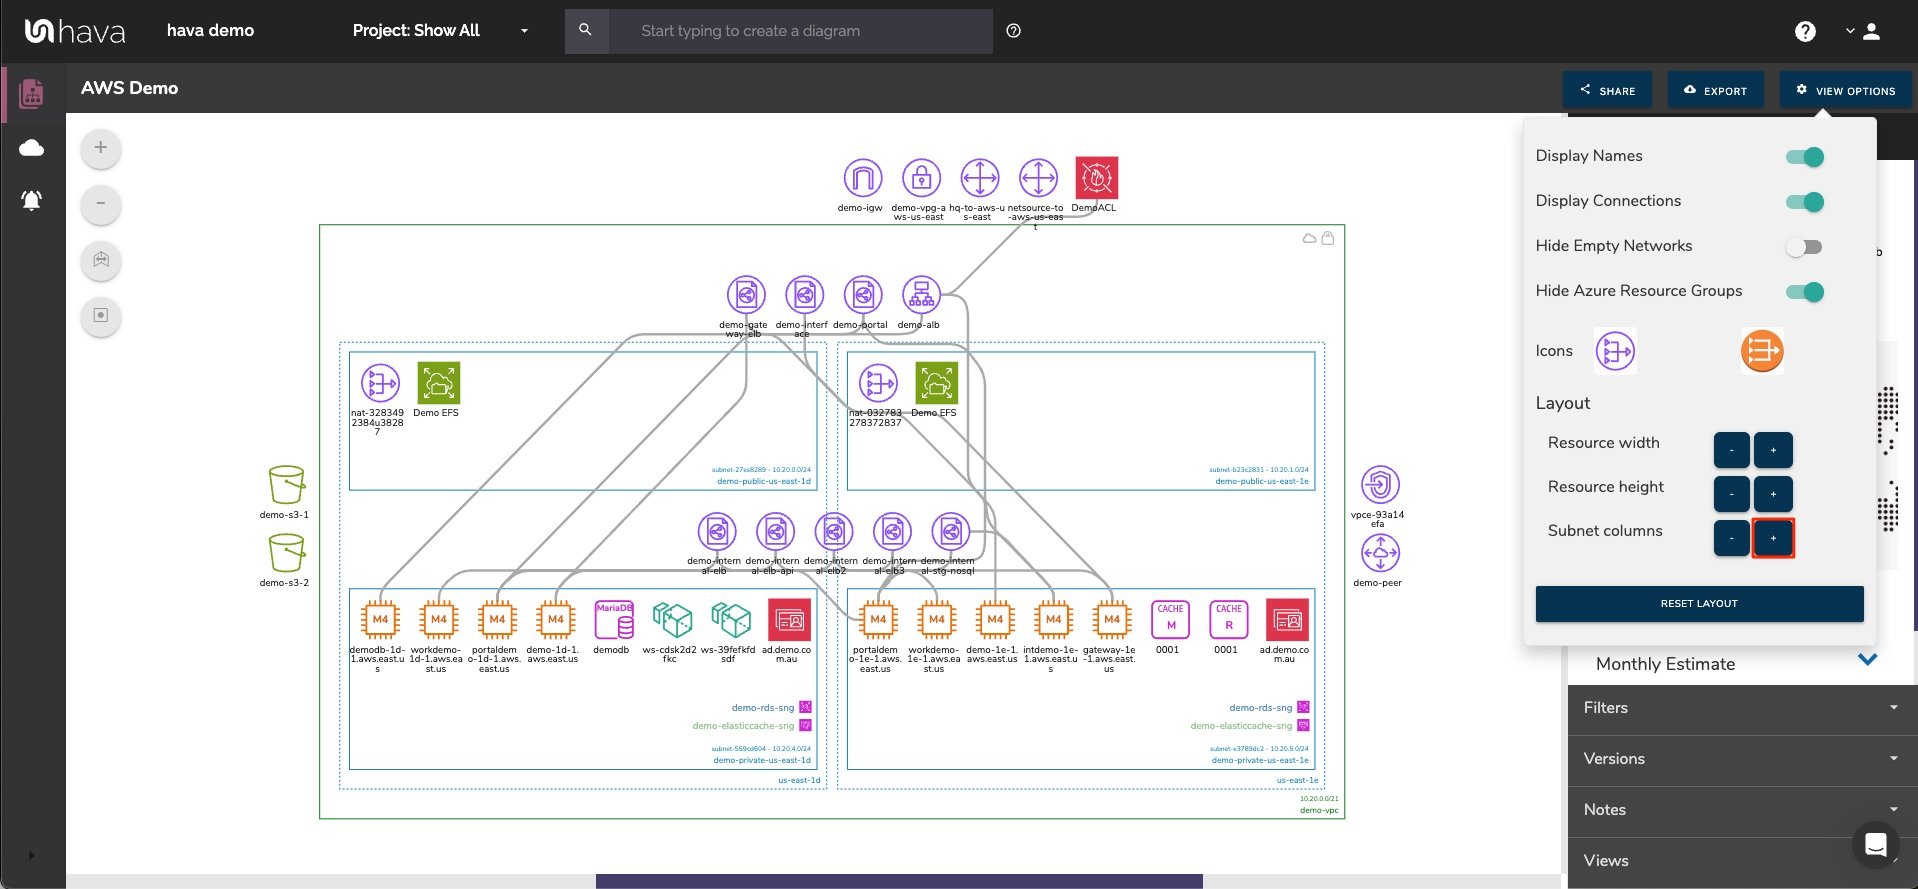
As organizations increasingly adopt diverse cloud services from various providers, managing this multi-cloud environment can become a complex challenge. Effective visualization and management of these disparate systems are crucial for operational efficiency, security, and cost control. Automating multi-cloud diagrams is an essential strategy to tackle these challenges, and Hava.io offers a powerful solution tailored for this purpose.
Topics: aws azure gcp hybrid cloud
4 min read
Benefits of Automated Cloud Diagrams
By Alan Blackmore on June 24, 2024
Streamlining Cloud Operations with Hava.io
Topics: aws azure gcp
3 min read
Automating Cloud Security Diagrams
By Alan Blackmore on June 19, 2024
Automating Cloud Security Diagrams with Hava.io
Topics: aws security azure devsecops
5 min read
Disaster Recovery Cloud Diagrams
By Alan Blackmore on June 17, 2024
It is important for businesses and their engineering staff to have a good understanding of how their cloud infrastructure works and how it hangs together.
This is never more important than during disaster recovery. Having disaster recovery cloud diagrams on hand informs your team on exactly what should be there, what is missing and whether a recovered or restored environment has all the components and resources that need to be there.
One way to help with this understanding is dynamic cloud diagrams that illustrate the various components and how they fit together. Then by capturing changes into a versioning control system you can see the evolution of the architecture and the point at which things went wrong.
In this post, we will look at the benefits of automating the creation of dynamic cloud computing diagrams.


