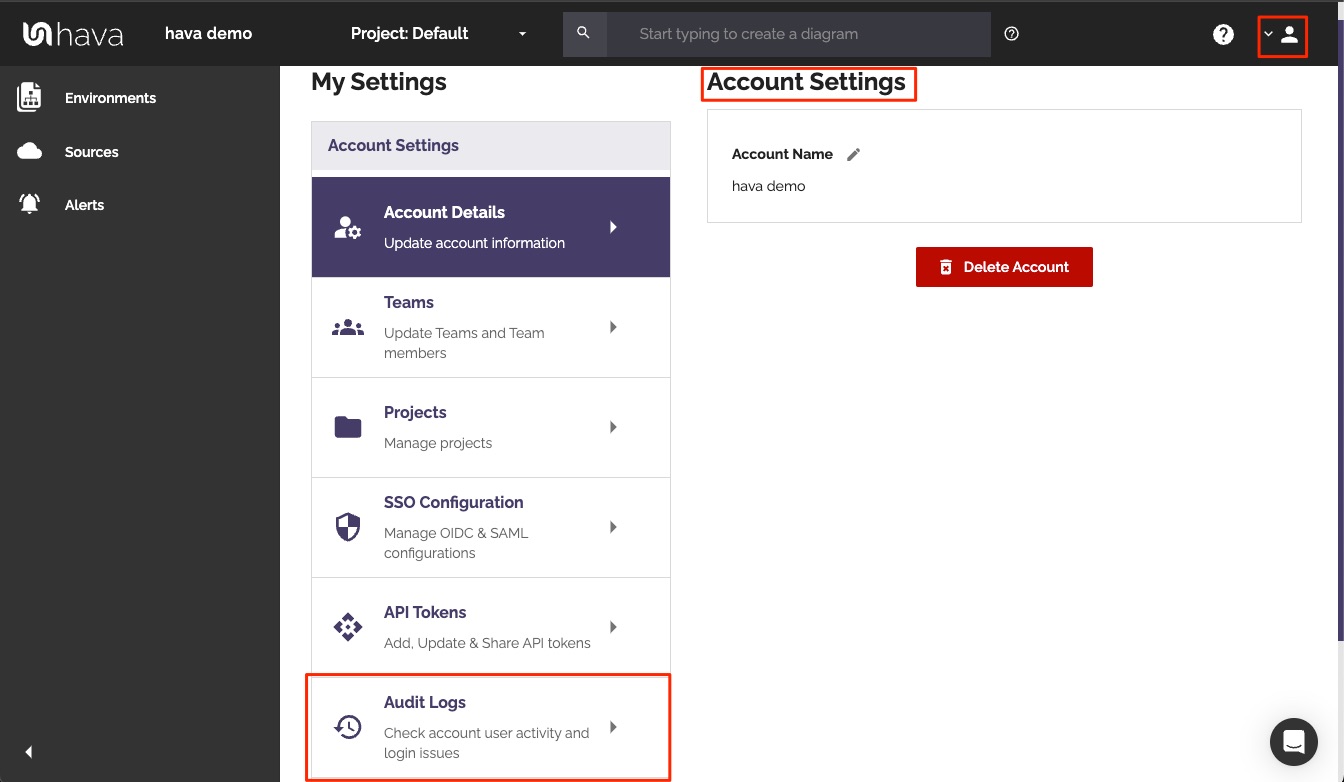
Team Hava is pleased to announce that the account audit log feature is now generally available.
1 min read
Hava Account Audit Logs are Generally Available
By Alan Blackmore on April 16, 2024
Topics: Features
99 min read
Cloud Computing Glossary of Terms
By Team Hava on October 9, 2020
We've put together what we believe is the most comprehensive glossary of cloud computing terminology available.
Topics: Features aws security azure gcp diagrams api
4 min read
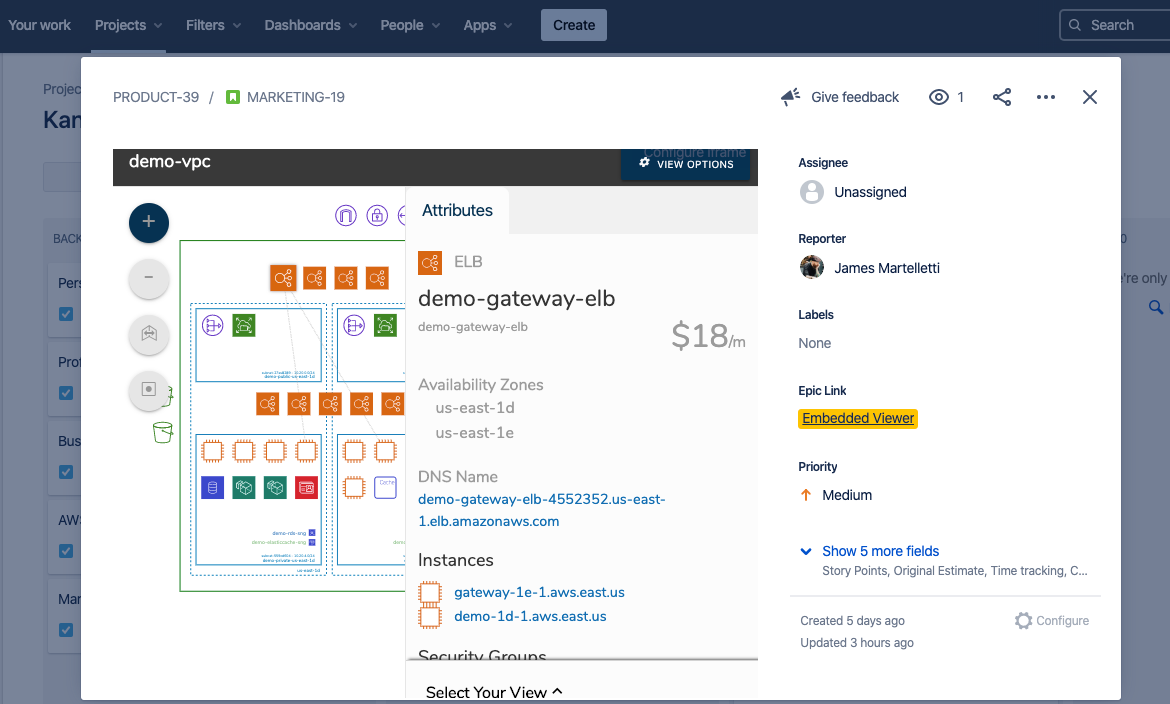
Embed interactive cloud architecture diagrams anywhere
By Team Hava on September 29, 2020
Topics: Features aws cloud Documentation azure gcp visualization
4 min read
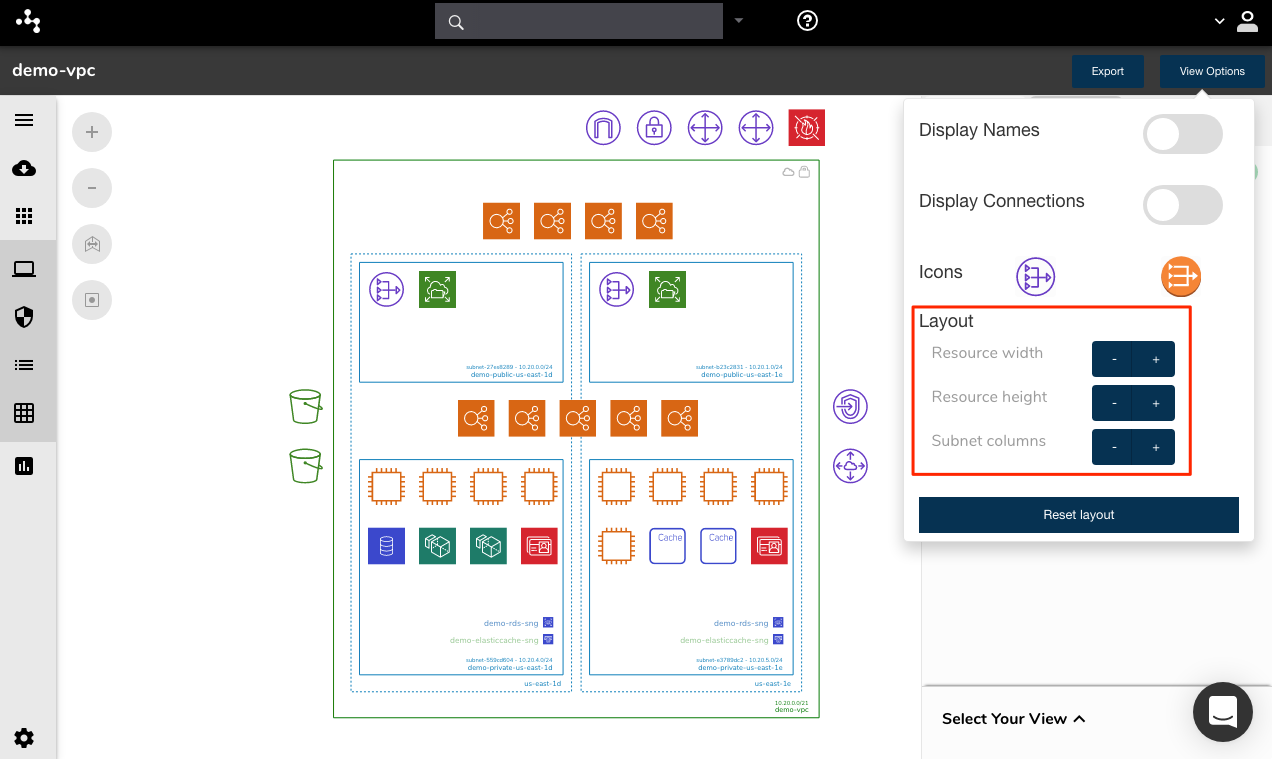
Hava Releases New Cloud Diagram Layout Controls
By Team Hava on August 27, 2020
Hava cloud infrastructure diagrams now have more flexibility and control so you can adjust the layout canvas to better suit your requirements.
Topics: Features aws cloud Documentation azure gcp visualization news Version History vpc diagrams
8 min read
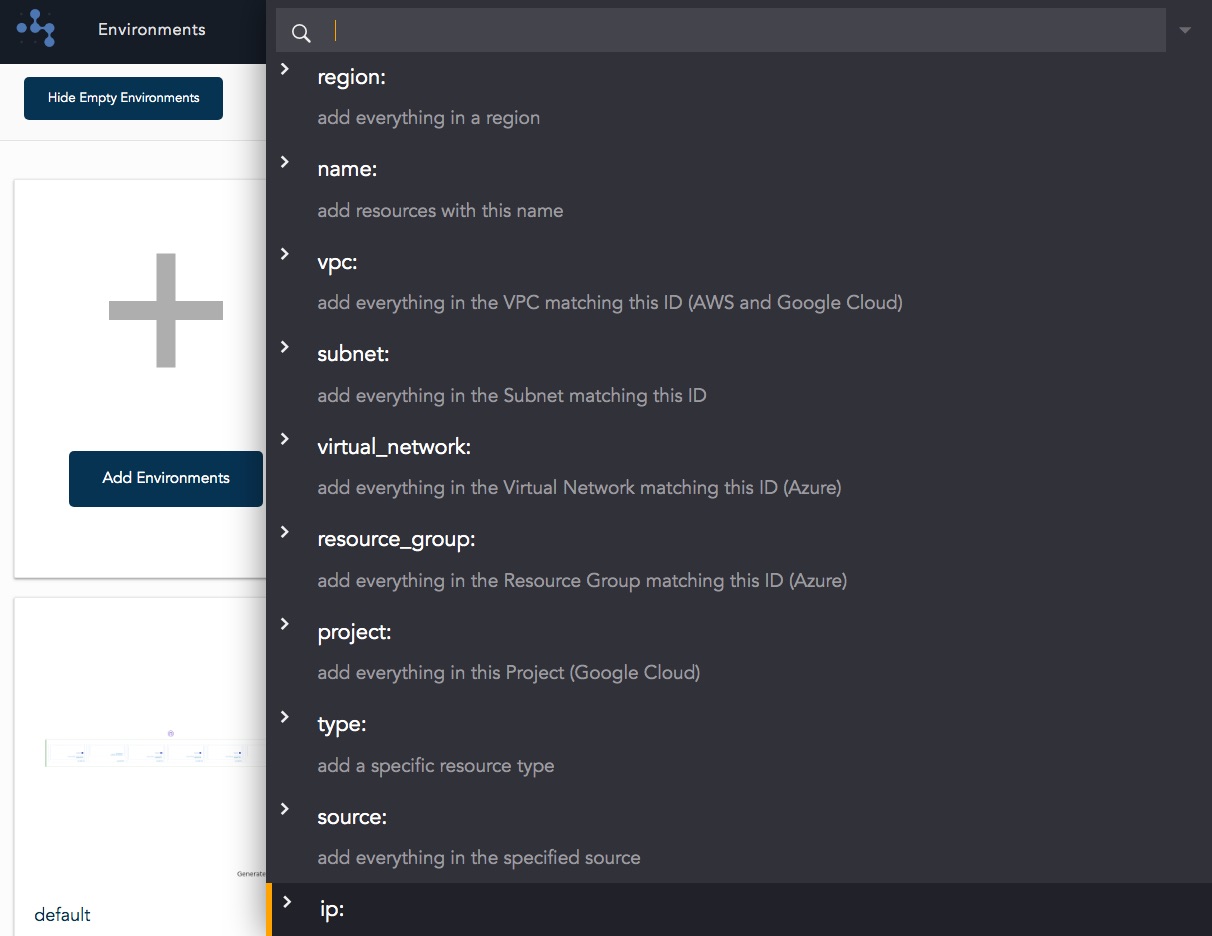
Expanded Search Enables Easy Creation of Custom Cloud Hava Diagrams
By Team Hava on May 21, 2020
Hava is happy to announce the release of a significant enhancement to the search functions used to help you quickly locate cloud resources and create custom infrastructure diagrams.
Topics: Features aws cloud Documentation azure gcp vpc
5 min read
How to monitor your cloud spend with Hava
By Team Hava on May 12, 2020
Topics: Features aws Documentation diagnose azure gcp visualization vpc
2 min read
AWS Icon Set 2019
By Team Hava on February 26, 2019
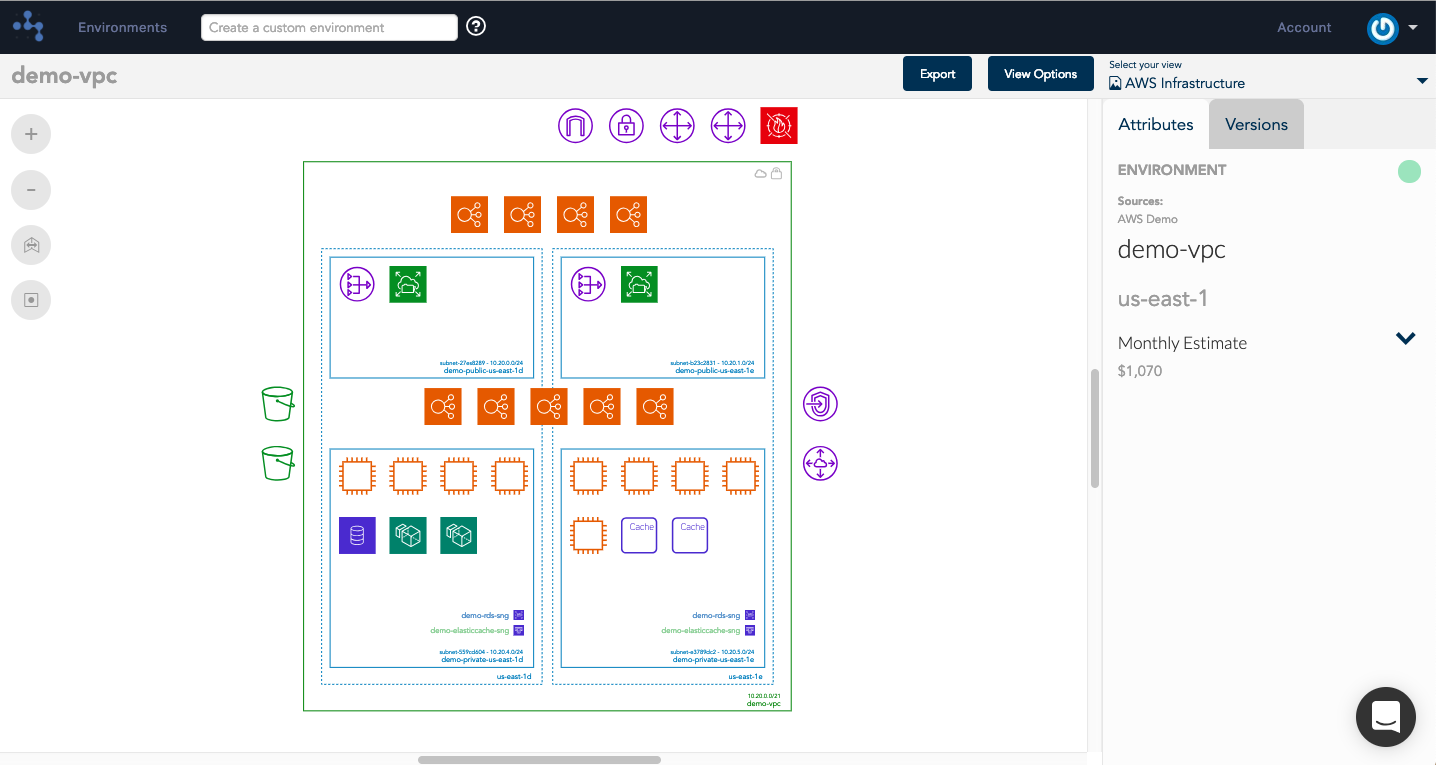
Amazon Web Services (AWS) have launched a re-designed set of diagram icons, the first version release was for AWS re:invent 2018, with the official public release on the 2nd of February 2019. Hava now supports diagrams using the new icon set, so you can discover, diagram, diagnose, and document your environments straight from the source of truth with a familiar style.
Topics: Features aws
8 min read
Cloudcraft vs. Hava
By Team Hava on December 4, 2018
Cloudcraft is known for their isometric AWS diagrams and often one of the tools used to depict the layout of your cloud environments, along with Lucidchart and Draw.io. We all need to start somewhere with our network diagrams, whether it's on a whiteboard, in a drawing tool or in a drag and drop builder.


