Amazon QuickSight is a popular cloud native serverless business intelligence (BI) service from AWS.
QuickSight allows you to connect data from just about anywhere and create interactive dashboards that are powered by machine-learning algorithms to help you understand your data, analyse patterns and identify outliers.
By connecting native AWS data sources like S3 or RDS, spreadsheets, big data, third party databases and other data sources to QuickSight, you can provide your organisation with easy to understand insights into key data which can help in the key business decision making process.
Your data sources can be both cloud based and on premise making the collating and insights provided by the QuickSight BI engine extremely comprehensive. With a rich interactive dashboard visualising your data, you can get the answer to business questions in an easy to read visual form and can expect lightening fast responses to the questions you ask QuickSight
Secure dashboards once published are made available on a variety of devices including mobile devices, email or embedded into your own applications.
QuickSight features ML powered insights to help you discover hidden trends, identify key business drivers, forecast upcoming business results and summarize your business data in plain natural language.
QuickSight is a fully managed solution protected by enterprise grade security taken care of by AWS global infrastructure which means highly available infrastructure with built in redundancy that you can scale from a handful of users to tens of thousands without the need to provision or deploy any AWS resources.
QuickSight is billed on a usage basis, so you only pay for the sessions in use, so there are no upfront costs and you don’t end up paying for inactive licences.
QuickSight Use Cases.
End users
Users within your organisation can ask natural language questions and receive answers and visualizations. QuickSight Q leverages ML to interpret the question intent and will analyze the data and provide answers.
Developers
You can share data visualizations and deploy analytics at scale using robust AWS APIs to thousands of users via web, mobile, email or embedded into applications
Administrators
QuickSight assists admins on a number of fronts. Firstly the serverless architecture allows the service to scale in response to workload without intervention and regularly provides updates so users always have the latest features. The pay-per-session pricing model means it is affordable for smaller organizations and cost effective for large scale deployments where you may have thousands of users because you only pay for those users instantiating BI sessions.
Business Analysts
Analysts can create dashboards in minutes to provide serious business intelligence to thousands of users. You can for instance connect to petabytes of data in Amazon S3 and using Amazon Athena and share with tens of thousands of users via QuickSight without any server infrastructure and without users having to install or provision any client software
On top of great looking dashboards, you can also deliver personalized email reports and alerts for end users and provide mobile access via QuickSight’s iOS, Android and mobile web
QuickSight AWS Native Integrations
Amazon QuickSight as you would expect has strong connectivity to other AWS services.
You can connect to private VPCs for secure access to data storage like Amazon RDS, Redshift, Exasol, and Snowflake.
Native IAM permissions allow you to seamlessly integrate Amazon S3 and Athena using fine grained access control.
Amazon Sagemaker is also integrated with QuickSight so you can leverage complex ML models without having to establish complex data pipelines.
Amazon QuickSight Example Dashboards
AWS has a gallery of sample QuickSight dashboards showcasing the variety of ways you can visualize your data.
Cost Intelligence - displays AWS billing details
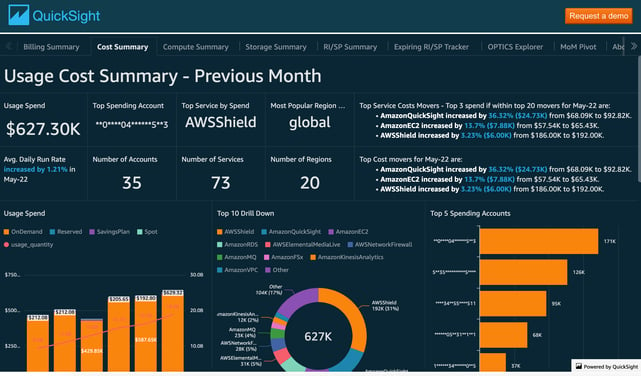
https://d2lzvqq4w5ulk4.cloudfront.net/?dashboardName=ci
Retail Insights - Answers a number of questions posed by a retailer like most popular product, what locations are driving sales, sales forecasts, ratios of sales vs discounts
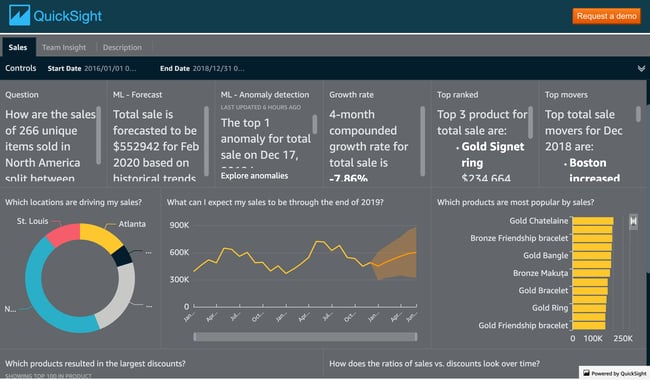
https://d2lzvqq4w5ulk4.cloudfront.net/?dashboardName=retailSales
Call Centre Dashboard - Operator stats from an e-commerce website call centre. Details things like call duration, agent performance, sales, agent feedback across product categories.
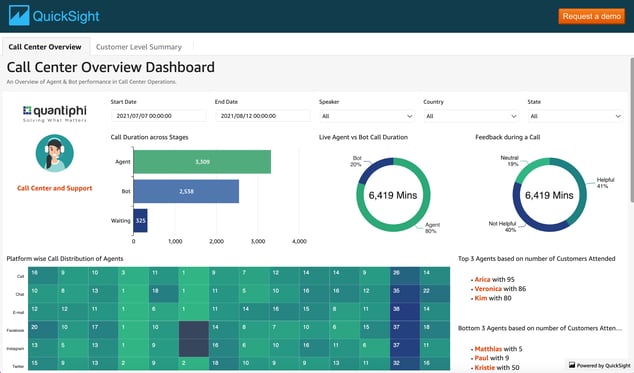
https://d2lzvqq4w5ulk4.cloudfront.net/?dashboardName=callcenter
There is no limit to the type of data and visualisations you can build into a QuickSight dashboard.
Amazon QuickSight Q
Amazon QuickSight Q is a natural language query method of asking QuickSight for business intelligence data. Using Q you can ask business questions in natural language like “What is our average user churn rate this year” or “What is our Net profit this year to date” and QuickSight will return accurate answers and relevant visualisations to help gain insights into the known data.
Q uses machine learning to determine the intent of a question and then analyze the correct data in order to return useful information. Q’s ML determines the meaning and relationships between business data to enable the production of relevant results when queried.
Q is also pre-trained on data from many sales, marketing and financial services as well as HR, healthcare and sports analytics so the chances are it will understand the business questions you are asking.
The major advantage of QuickSight Q is the speed of response. You get your answers and visuals quickly without having to wait weeks for the BI team to create new ML models and update dashboards for every new question you need to answer.
How does Amazon QuickSight pricing work?
QuickSight users are divided into Authors and Readers.
Authors have the ability to create and share dashboards while Readers can view dashboards, receive email reports and download data. With Q enabled, readers can explore topics shared with them by entering queries in Q
Pricing for Authors is a monthly charge and reduces for a yearly commitment. The pricing increases when Q is enabled. AWS Author accounts with Q enabled also get charged a fixed monthly fee for Q.
Readers are charged on a per session basis currently $0.30 per session to maximum of $5 per month (or $10 with Q enabled)
Full details on the current QuickSight pricing can be found at : https://aws.amazon.com/quicksight/pricing/
So that’s a quick look at the AWS QuickSight Business Intelligence platform. If you are in any way BI curious, you should check it out.
If you are building or managing applications on AWS you can use hava.io to automatically generate interactive diagrams so you can visualise your network topology, security groups, AWS best practice compliance, ECS and managed Kubernetes clusters. And once your AWS (or GCP, Azure and Kubernetes) diagrams are generated, they keep themselves up to date, all hands free.
Like QuickSight, you can embed your Hava diagrams in other web properties either as a self updating JPG, a fully interactive diagram with settings and metadata, or as a “Lite” version that details resources, names and connections but suppresses sensitive metadata.
You can take Hava for a free 14 day trial, learn more using the button below