What is the AWS CLI?
The AWS CLI Command Line Interface allows you to interact with your AWS services and resources via the command line terminal on your local machine....
Traditionally when a number of alarms are triggered at once due to an even or a surge in traffic to your site or application, it is often difficult to determine which alarm points to the cause of the problem and which alarms are simply symptoms of the underlying issue.
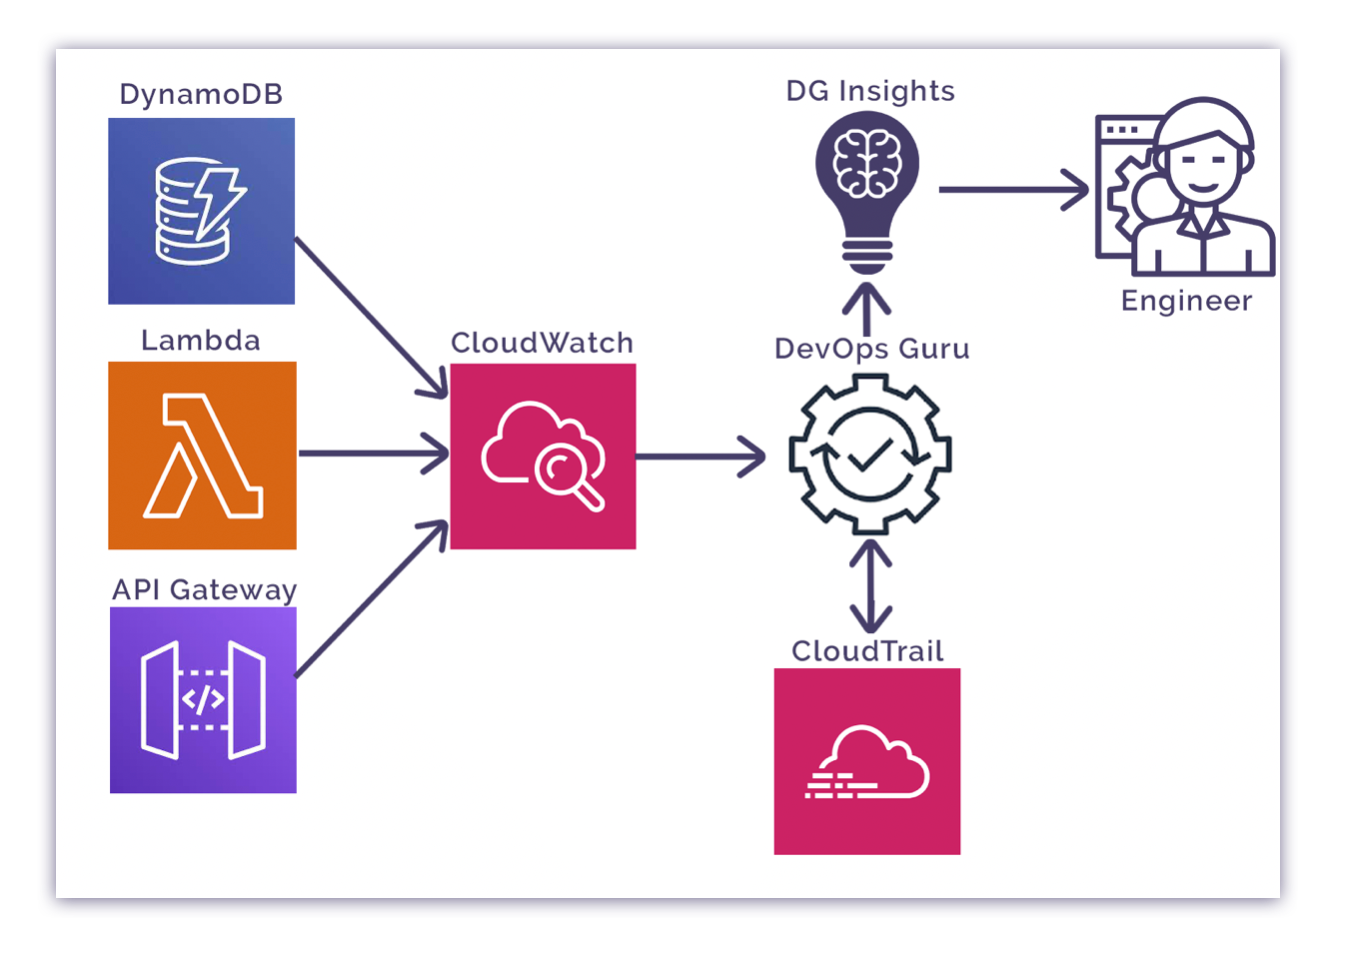
DevOps Guru dynamically sets standard thresholds and adjusts them according to the behavior of your resources then when an issue is detected it systematically stitches together a sequence of co-related events and packages them into an insight that may lead an engineer to the root cause of the problem quicker. The insight provides guidance on how to resolve identified issues.

DevOps guru ingests data from CloudWatch and monitors against the parameters set by the ML models. When a potential issue is detected, DevOps guru gathers log data from CloudTrail from the resources related to the trigger issue and builds an insight containing the possible ways to resolve the issue.
The benefit of this approach is that the operator or engineer only has all the information collated into the insight instead of having to investigate multiple alarms and then analysing the alarm and going to the logs for each associated resource to establish what the problem could be. The insight will already have suggestions on how to resolve the potential problems identified.
DevOps guru can monitor CloudFormation stacks and using a stack set it is possible to monitor resources across multiple accounts.
Notifications can be set up Via SNS notifications. This means you can set up a central notification target, being an SNS topic in one account and receive SNS notifications from DevOps Guru running in multiple other AWS accounts. This would be an effective way of monitoring client or managed service accounts from a central DevOps or company AWS account.
Notifications can also be integrated with popular incident management tools like Atlassian Opsgenie, PagerDuty or AWS Systems Manager OpsCenter. In the case of OpsCenter, whenever a notification is received a new ticket is raised in OpsCenter with the details from the insight filled in.
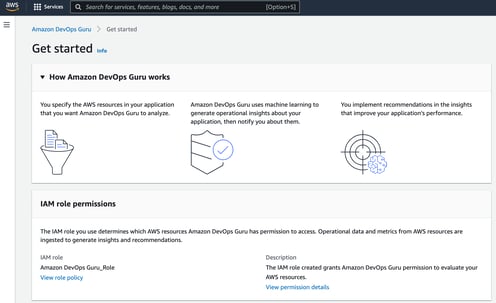
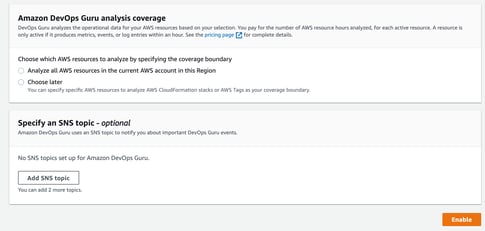
When you initiate DevOps guru (either from the CLI or console) you can specify the resources you wish to monitor, or can tell DevOps guru to monitor everything in your account. The service is charged by the number of resource hours analyzed for each active resource.
To limit the service to just the most important resources, like say a production environment, you can nominate AWS cloudformation stacks or AWS tags.
You may also limit access to resources using an IAM policy. When you instantiate the service, you can specify an IAM role or use the default DevOpsGuru_Role and edit the policy should you wish to remove access to resources that are triggering insights unnecessarily. The current services accessed are :
"Effect": "Allow",
"Action": [
"autoscaling:DescribeAutoScalingGroups",
"cloudtrail:LookupEvents",
"cloudwatch:GetMetricData",
"cloudwatch:ListMetrics",
"cloudwatch:DescribeAnomalyDetectors",
"cloudwatch:DescribeAlarms",
"cloudwatch:ListDashboards",
"cloudwatch:GetDashboard",
"cloudformation:GetTemplate",
"cloudformation:ListStacks",
"cloudformation:ListStackResources",
"cloudformation:DescribeStacks",
"cloudformation:ListImports",
"codedeploy:BatchGetDeployments",
"codedeploy:GetDeploymentGroup",
"codedeploy:ListDeployments",
"config:DescribeConfigurationRecorderStatus",
"config:GetResourceConfigHistory",
"events:ListRuleNamesByTarget",
"xray:GetServiceGraph",
"organizations:ListRoots",
"organizations:ListChildren",
"organizations:ListDelegatedAdministrators",
"rds:DescribeDBInstances",
"pi:GetResourceMetrics",
"tag:GetResources",
"lambda:GetFunction",
"lambda:GetFunctionConcurrency",
"lambda:GetAccountSettings",
"lambda:ListProvisionedConcurrencyConfigs",
"lambda:ListAliases",
"lambda:ListEventSourceMappings",
"lambda:GetPolicy",
"ec2:DescribeSubnets",
"application-autoscaling:DescribeScalableTargets",
"application-autoscaling:DescribeScalingPolicies",
"sqs:GetQueueAttributes",
"kinesis:DescribeStream",
"kinesis:DescribeLimits",
"dynamodb:DescribeTable",
"dynamodb:DescribeLimits",
"dynamodb:DescribeContinuousBackups",
"dynamodb:DescribeStream",
"dynamodb:ListStreams",
"elasticloadbalancing:DescribeLoadBalancers",
"elasticloadbalancing:DescribeLoadBalancerAttributes"
],
"Resource": "*"
},
When you instantiate DevOps guru you can also nominate or create up to two SNS topics to receive notifications. You would then subscribe interested parties to the topic to receive the insights as they are generated.


When you enable the service it will take around 2 hours to establish a base line. It is worth mentioning that if you are experiencing problems when you initiate DevOps Guru, then there is a chance that this will be ingested as part of the baseline which could prove problematic when trying to isolate the application or environment behavior you are trying to identify.
So that’s a quick look at Amazon DevOps Guru and what it’s used for.
If you are building applications or environments on AWS and are not using Hava to automatically visualize your AWS environments, we invite you to take a 14 day free trial using the button below.
Hava auto generates cloud network topology diagrams for AWS as well as Azure and GCP completely hands-free.
The diagrams created are fully interactive, so instead of flooding the diagrams with lots of metadata related to the visualised resources, Hava retains this information in a side panel, so you can select a resource like an EC2 instance or a database and the details in the attribute pane change to show all the known settings for the selected resource.
Once established Hava keeps your network diagrams up to date automatically and places the superseded diagrams in a version history that is also fully interactive. This provides you with an audit trail of changes to your AWS environment so you can investigate changes and pull up current and previous environment diagrams to visually compare and easily identify resource changes. Learn more here:
The AWS CLI Command Line Interface allows you to interact with your AWS services and resources via the command line terminal on your local machine....
Use this AWS CLI Command Reference Guide to view all the available commands in the AWS Command Line Interface from L - Z. Each command details the...
AWS Cost Anomaly Detection is an ML based service to alert you when your AWS resource costs spike or dip unexpectedly. In this post we take a closer...