Creating Cloud Infrastructure Charts with Hava.io
Experienced cloud engineers understand that maintaining a clear, updated visualization of your cloud infrastructure is crucial. Cloud infrastructure charts, or diagrams, provide essential insights into the architecture, helping teams manage deployments, improve security, optimize costs, and enhance system reliability.
Hava.io is a standout solution for creating comprehensive and dynamic cloud infrastructure charts for AWS, Azure and GCP. This article explores how Hava.io can transform your cloud management strategy by having near real-time diagrams of all of your cloud architecture generated and updated hands free so you always have them on hand when you need them.
Understanding Cloud Infrastructure Charts
Cloud infrastructure charts are graphical representations that map out the relationships and dependencies between various cloud components such as compute instances, storage systems, networks interfaces, and software functionalities. These charts are vital for:
- Documentation: Providing a clear overview of the cloud architecture for management and operational purposes.
- Troubleshooting: Helping quickly identify issues within the cloud infrastructure.
- Security Analysis: Highlighting potential security vulnerabilities.
- Capacity Planning: Assisting with the assessment of existing resources and planning for future needs based on actual usage and demand.
Hava.io: Automating Cloud Diagram Creation
Hava.io automates the creation of cloud infrastructure charts, integrating directly with cloud service providers like AWS, Azure, and Google Cloud. By automating this process, Hava.io offers several key benefits:
- Real-time Visualization: Automatically updates charts to reflect changes in the cloud environment, ensuring that all stakeholders have the latest information.
- Accuracy and Consistency: Minimizes human error and maintains a consistent format for cloud diagrams, essential for accurate documentation and analysis.
- Scalability: Effortlessly handles scaling of cloud resources, automatically adjusting diagrams to incorporate changes without manual intervention.
- Security Enhancements: Provides detailed views of network setups and security configurations, aiding in quick identification and rectification of security threats.
Benefits of Using Hava.io
Using Hava.io for creating cloud infrastructure charts offers multiple advantages:
- Efficiency: Saves time and resources by automating the diagramming process, allowing IT staff to focus on more strategic tasks.
- Collaboration: Enhances team collaboration with shareable, interactive diagrams that are accessible in real-time from anywhere.
- Compliance: Helps maintain compliance with regulatory requirements by providing a clear audit trail of infrastructure changes and current configurations.
- Cost Management: Aids in identifying underutilized resources and potential areas for cost reduction.
Practical Applications of Cloud Infrastructure Charts
- Disaster Recovery: Facilitates rapid recovery actions during outages by providing clear pathways and dependencies.
- Migration Projects: Assists in planning and executing migrations between on-premises data centers and cloud or between different cloud platforms.
- Security Audits: Streamlines security audits by providing a visual breakdown of the security architecture.
FAQ about Creating Cloud Infrastructure Charts with Hava.io
- How does Hava.io access data to create charts?
- Hava.io uses secure API connections to fetch read only configuration data directly from your cloud service providers.
- Can Hava.io integrate with multiple cloud platforms simultaneously?
- Yes, Hava.io supports multi-cloud environments and can integrate with several cloud platforms like AWS, Azure, and Google Cloud to create unified infrastructure charts. Hava can also connect to stand alone Kubernetes clusters.
- What types of charts can Hava.io generate?
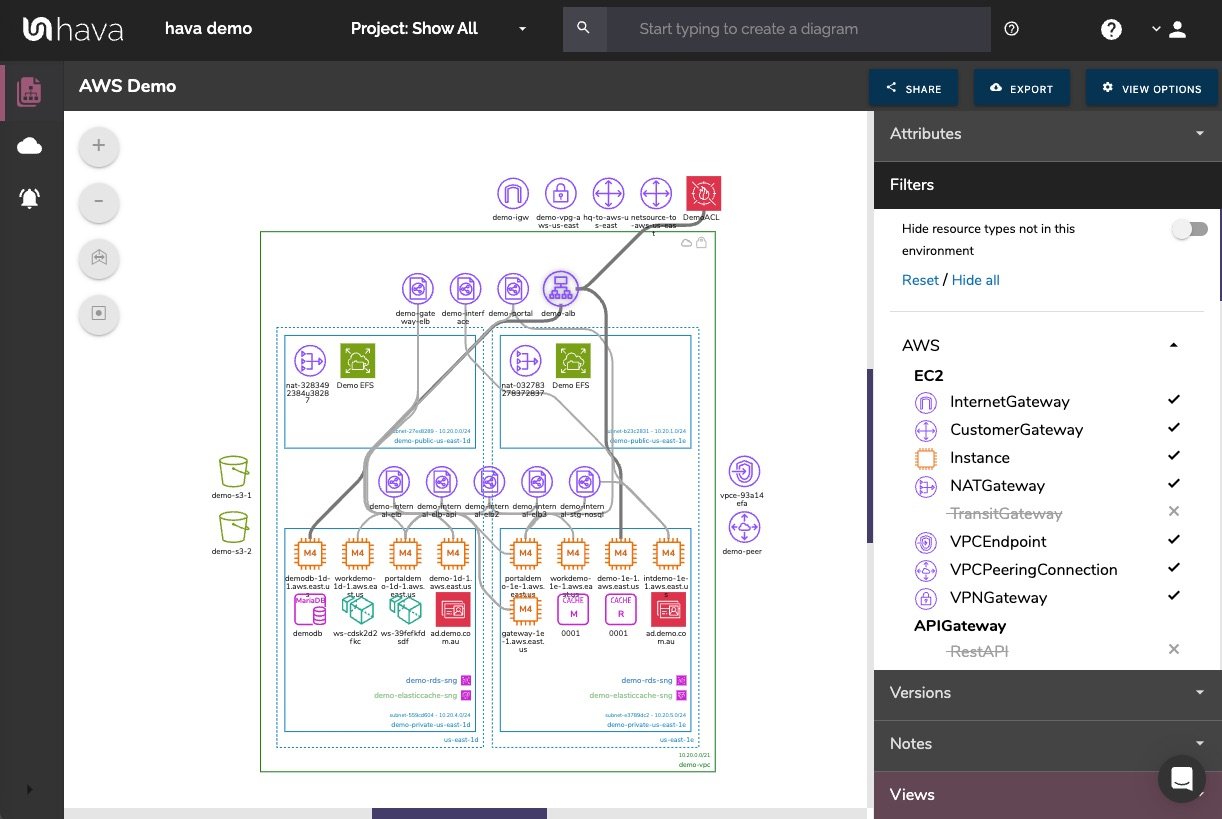
- Hava.io can generate a variety of diagrams including network topology maps, security configurations, and container utilization charts.
- How secure is Hava.io?
- Hava.io prioritizes security and uses encryption and robust authentication measures to ensure data security.
- Can I customize charts generated by Hava.io?
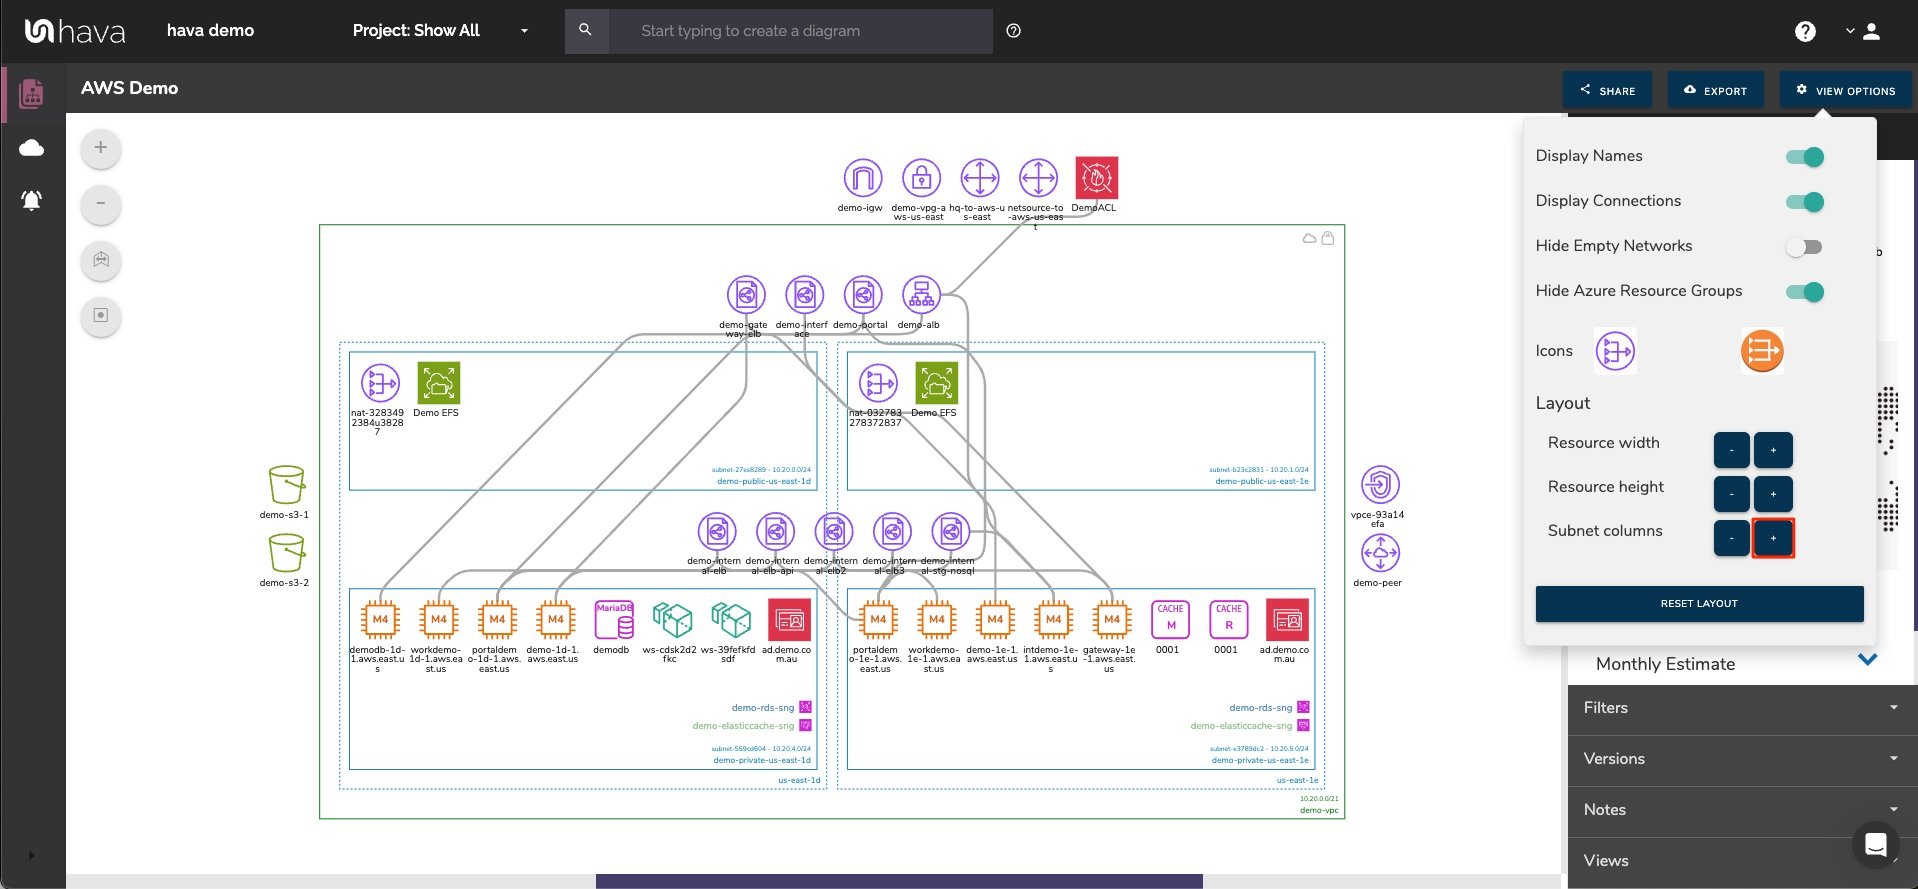
- Yes, Hava.io offers layout customization options to tailor charts according to specific organizational needs and preferences and the ability to draw custom connections and annotate diagrams.
- Does Hava.io support historical data visualization?
- Yes, Hava.io maintains historical versions of diagrams, allowing users to track changes over time and revert to previous configurations if necessary.
- How does Hava.io help with cost management?
- By visualizing resource utilization and dependencies, Hava.io helps identify and eliminate inefficiencies, thus reducing costs.
- Is training required to use Hava.io?
- Hava.io is designed to be user-friendly with an intuitive interface, minimizing the need for extensive training.
- How does Hava.io facilitate team collaboration?
- Hava.io allows teams to access and collaborate on cloud diagrams in real-time, enhancing communication and coordination.
- Does Hava integrate with other industry standard tools?
- Yes, Hava.io has custom integrations with Terraform, Github, Confluence and has a fully documented API
Conclusion
Hava.io provides a sophisticated, yet user-friendly solution for creating dynamic cloud infrastructure charts, making it an invaluable tool for organizations looking to enhance their cloud management strategies.
By automating the process and offering a suite of powerful features, Hava.io not only saves time and costs but also improves security and compliance, driving better business outcomes for teams building cloud solutions.