
AWS, Azure and GCP on the same automatically updated diagrams.
See what's configured now, or select an archived fully interactive diagram captured at every state change since connecting to Hava.
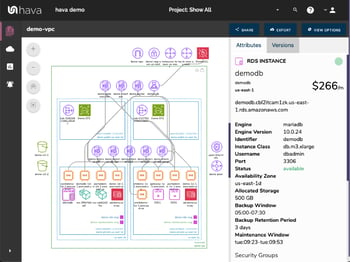
We'll show you exactly how your cloud hangs together
Hava uses automated layouts to display your real-time cloud infrastructure. Securely import all your AWS accounts to Hava by creating a read-only Cross-Account role. Your diagrams are then generated using AWS icons at the VPC level. You'll see all resources and their specifications, attributes, connections, security groups, route tables and cost estimates.
Connect your GCP and Azure accounts using read-only credentials
You only need to connect once. You can then sync your accounts on-demand and automatically every hour to visually see and record changes.
Quite frankly your engineers and expensive consultants could be doing way more important tasks than manually drawing and updating infrastructure diagrams. Don't waste the time and resources creating static diagrams and then waste even more time keeping them up to date.
With Hava, you can export real-time network diagrams to PDF, PNG, Visio, CSV & JSON instantly.
As your infrastructure changes, Hava captures the change via continuous config monitoring. For live data, simply sync and export a diagram of your new infrastructure from Hava to include in your wiki, reports and presentations.
When you get an alert or decommissioning email, you need to be able to quickly find that resource and see what's going to be impacted. If you have multiple AWS accounts - then there's normally nothing quick about it. Hava finds your resources in seconds and shows you graphically what impact it could have on your environment and running products.
Filter will show your all VPCs and Virtual Networks that contain the information you are looking for.
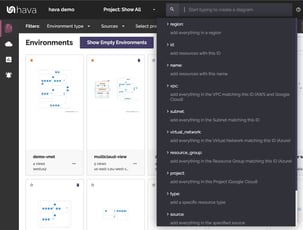
Search allows you to search all your accounts to generate custom diagrams with multiple criteria of Region, AZ, ID, IP, Subnet, Resource Group or Tag that you can then save.
You can select sources from multiple cloud vendors to create a hybrid cloud diagram.
Managing projects across multiple accounts, VPC's and Cloud Platforms has never been easier.
The unique security view in hava allows your security team to see all of your AWS security groups and the open ports that enable traffic to transit your network. See the ingress points, IP addresses, traffic destinations and egress points all layed out over logically visualized security groups.
This makes it infinitely easier for your security team to identify anomalies and vulnerabilities especially in dynamic environments with multiple project teams pushing code live.
Not only are you saving masses of time and money analysing security, with hava's unique security versioning history you always have the documentation available should your security ever be called into question.
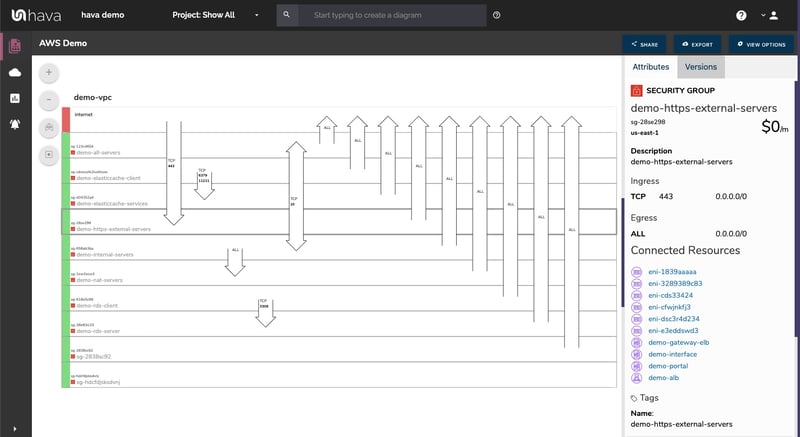
Then you can select a security group and see all the connected resources and network devices as well as the IP addresses of all ingress and egress points.
If you add Hava to your toolset, this one feature will pay dividends over & over. Your security team will love you for it.
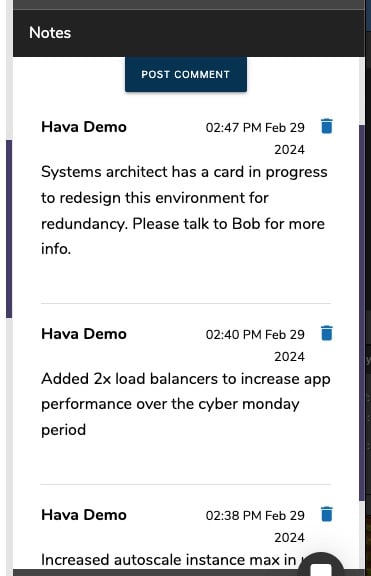
Add notes to any environment in your Hava dashboard.
Whether they are autogenerated or the result of a custom saved search such as a multi VPC or Multicloud diagram, you can add notes.
Tag other team members in the notes and they receive an email letting them know they have been mentioned and may be required to take some sort of action.
When your cloud architecture changes, so do your Hava diagrams. Automatically. This means you have a visual audit trail of any changes made to your architecture or security.
Working out the changes is also super easy. You can simply choose any two diagram versions using the revision comparison tool and Hava shows you what was added or what was removed.
This allows you to zero in on an issue during an outage to help resolve the problem faster. It also allows you to prep for audits and show auditors everything that changes since your last audit, which is exactly what they need to know.
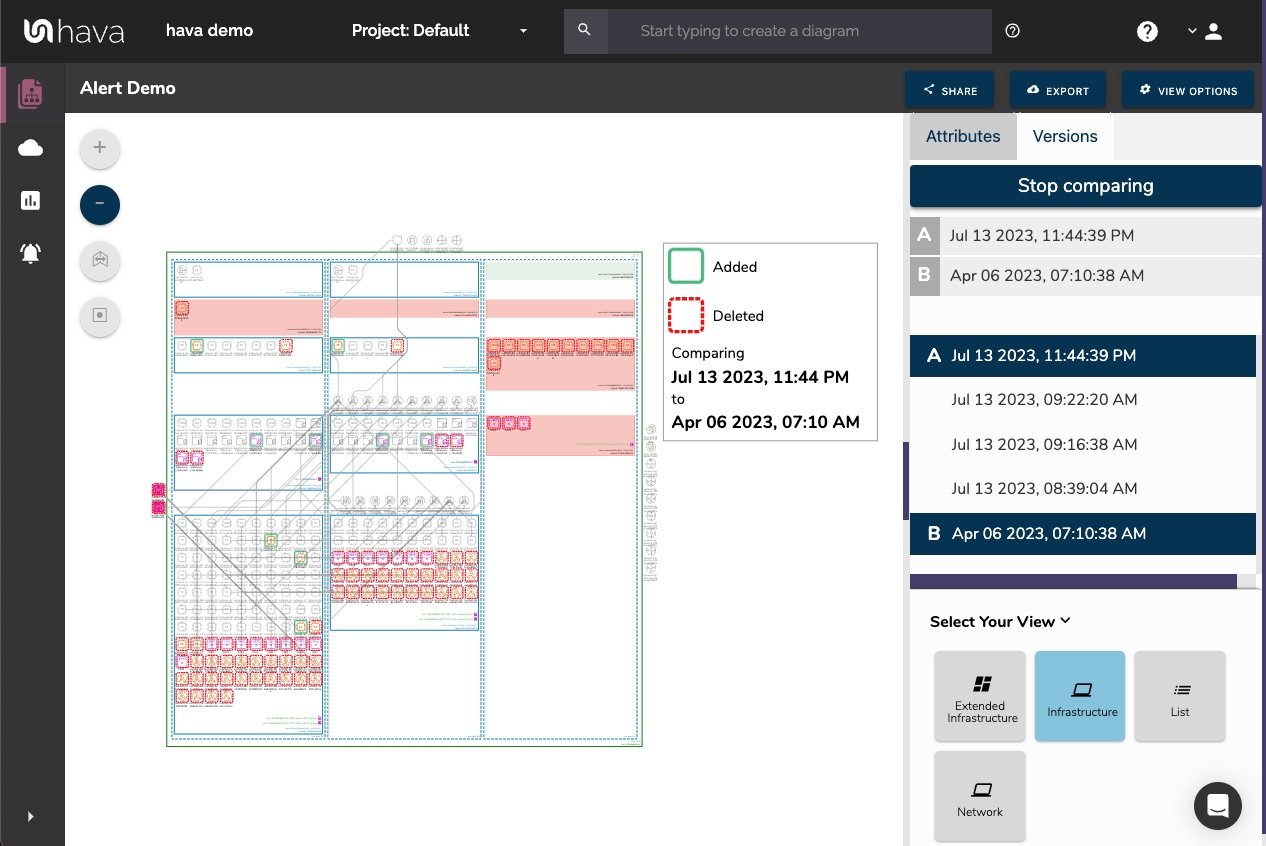
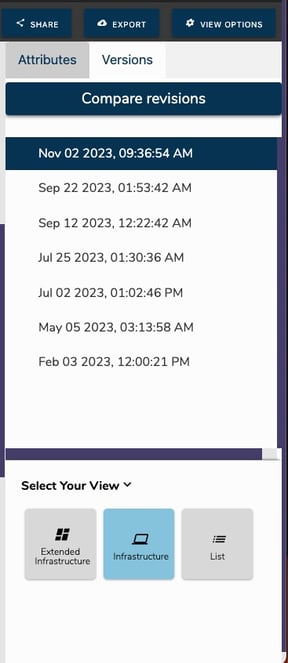
When you first connect your teams-level hava account to your cloud account data sources, hava starts to poll your configuration data daily or when a manual sync is invoked via the app or API.
When a change is detected, Hava creates a new set of infrastructure and security diagrams automatically. Instead of overwriting the documentation, Hava creates a new version and retains historical information.
The previous diagrams are fully interactive and contain all your previous configuration settings which means you can always view what your cloud looked like at any point since you connected it to hava.io
Why is that important?
This means you can compare the current and previous configs in easy to read diagram form to easily see the changes. You can also provide compliance and security auditors with evidence of your superior cloud management skills should they ever be challenged.
The interactive diagrams available within the hava dashboard are everything your engineering and security team needs to get the job done.
But as we all know, occasionally management request a status update or a client briefing is looming and telling the story of the current state of your cloud infrastructure is 100 times easier when supported by visual communication.
That's where the comprehensive export features built into hava come to the fore.

Easily export your infrastructure diagram as a pdf or png image file for easy inclusion into your reports.
If you're looking to style the diagrams, add your own data and design flair, then export the diagrams into Visio and tinker away.
Is the CFO or accountant after a breakdown of estimated costs across your cloud accounts. We've got that covered with a detailed CSV export option.
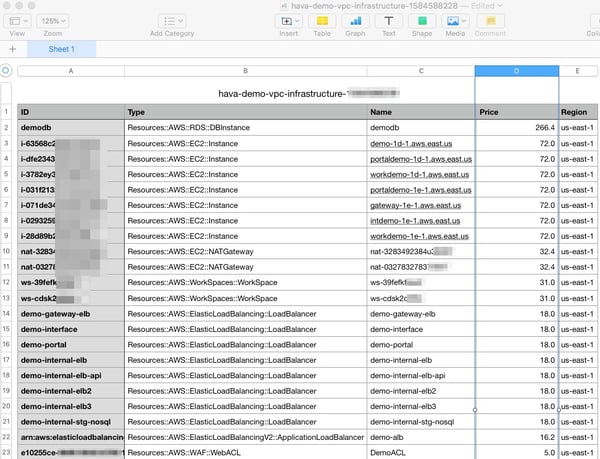
Open up with your spreadsheet of choice and sort by price to see where your cloud budget is being spent.
Hava can estimate the cost of your cloud infrastructure down to the individual resource level.
The cost estimates displayed will give you a good idea of the typical monthly runtime cost for your infrastructure.
Which means you can identify the resources attracting the most investment and avoid bill shock especially after network redesign or the addition of replica production stacks used for development and testing purposes.
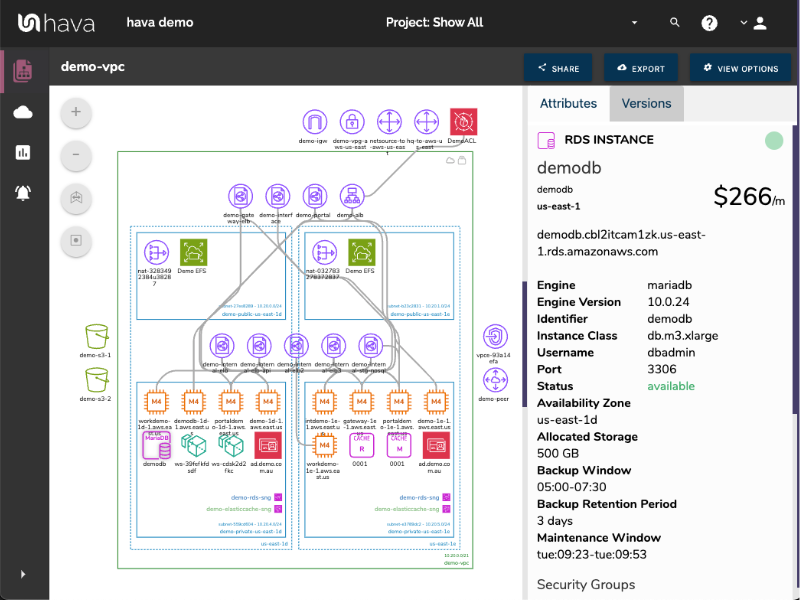
The Infrastructure view logically lays out your cloud environment by availability zone, VPC & subnet or virtual network & subnet.
Click on a resource to see all it's attributes in the right hand panel.
Hover over items in the attribute panel to highlight the associated resources on the diagram.
For instance, hover over a security group & the instances in that security group are highlighted on the diagram.
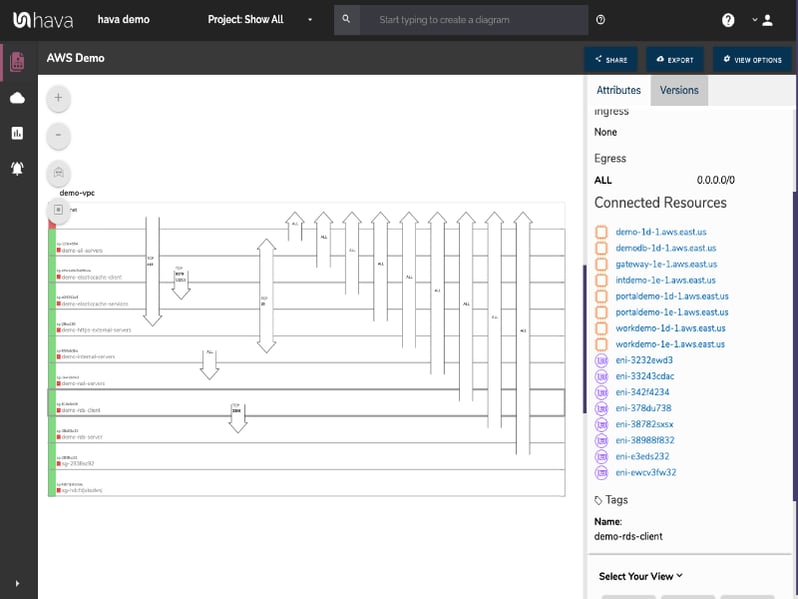
Take a helicopter view of your security groups and see all the open ports and how traffic transits your cloud network.
Select a security group on the diagram and see all the important information related to that group, like ingress and egress TCP Ports and their IP address, connected resources like autoscaling groups, EC2 instances and network interfaces.
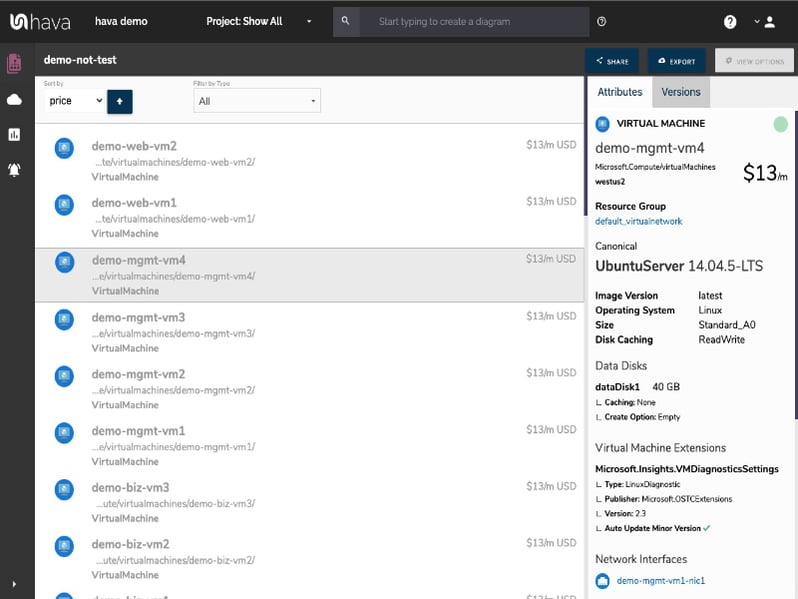
Some resources just don't make sense to visualize. Network Interfaces for instance. There could be dozens or hundreds in your configuration and including them on the diagrams would result in a huge unreadable mess.
The LIST VIEW solves the problem by gathering all your resources, both visualized and non-visualized so you can see, review and interrogate each one via the attributes panel.
Select a resource in the list view and as with all hava views, the contextual attributes panel displays all the important data about that resource.
With multiple sort options you can sort by price and see all your most expensive resources at the top of the list view.
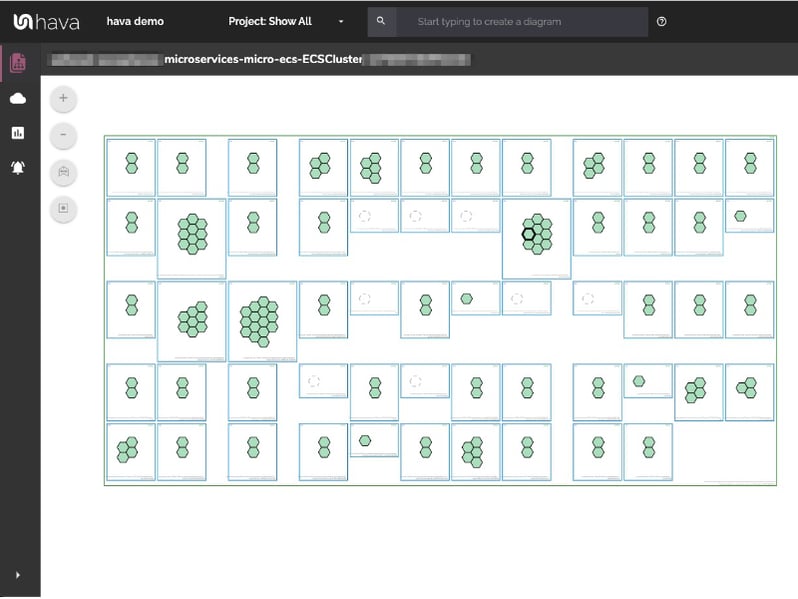
The container view logically lays out your AWS Container Clusters and visualizes the contained ECS services with their tasks shown as hexagon representations. With Kubernetes support in private beta, to be released soon
Click on any container, service or task to see all the associated settings & relationships in the side attribute panel.
With Hava's built-in embeddable diagram viewer, you can place diagrams externally via an iFrame code snippet. No login is required to view the live, fully interactive diagrams.
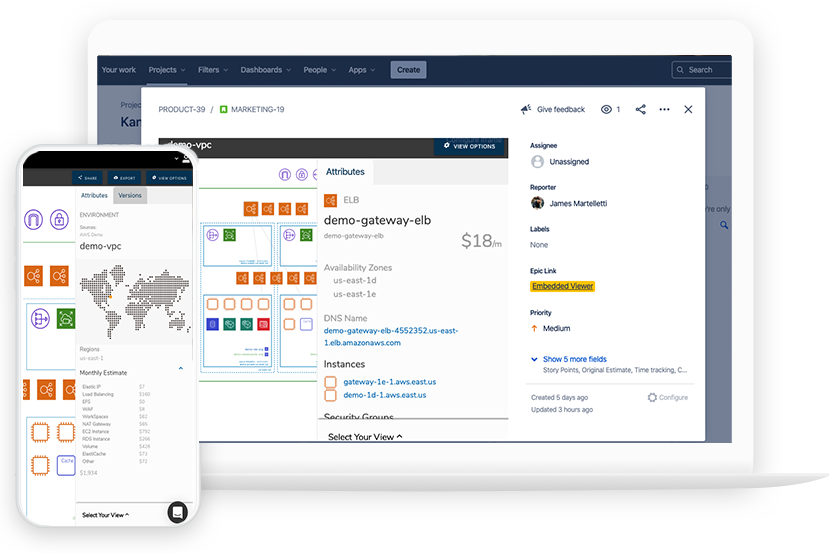
Hava integrates with the tools you use day to day, enabling you to include Hava diagrams where you keep your information.
Use the Hava CLI with the CI/CD tooling you already use.
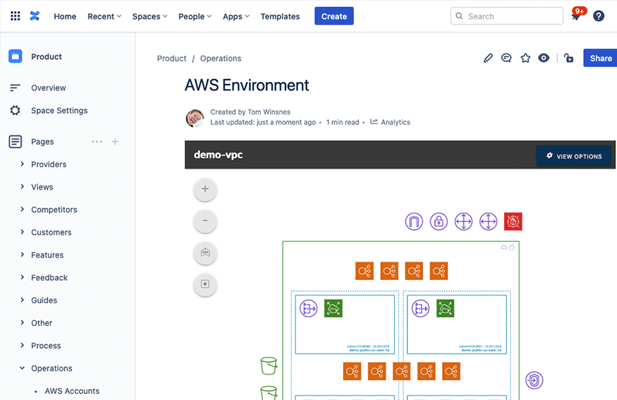 Display automatically updating diagrams together with your documentation in Confluence Cloud using the Hava Viewer plugin.
Get it on the Atlassian Marketplace
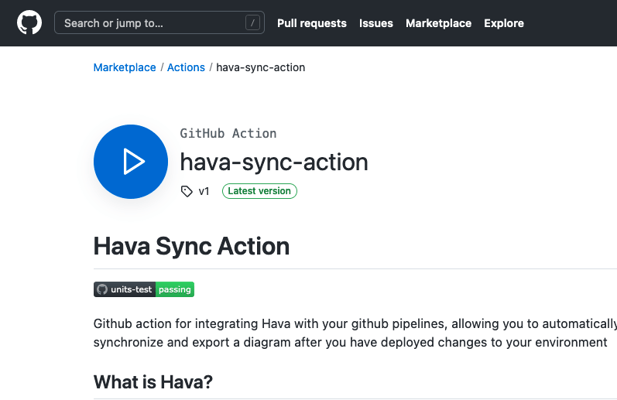 Add Hava to your workflows in GitHub with our Hava Sync Action. Automatically sync on change and export a diagram to include in your repository.
Get it on the GitHub Marketplace
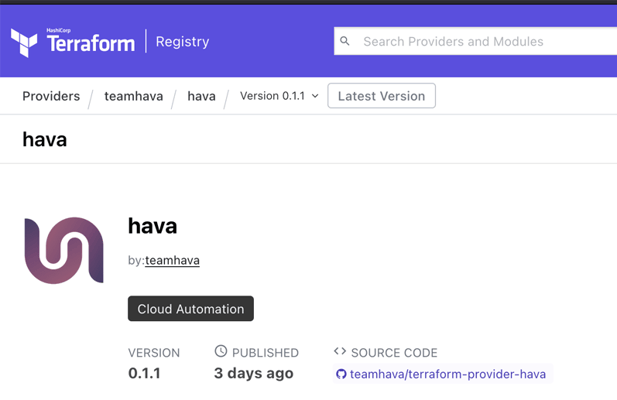 Integrate Hava into your GitOps practices by utilizing our Terraform Provider. Automatically onboard your cloud environments as you are deploying them.
Get it on the Hashicorp Terraform registry
Hava imports your actual configuration automatically and logically lays out the resources.
So you never have to manually create another diagram again. Of course you can still export your diagrams for use in your favourite graphics package.
Always be assured your diagrams are accurate as they are generated from the source of truth (your cloud config)
There's no opportunity to miss things, or add things that don't exist.
Hava's reporting module complements the array of automatically generated diagrams and change tracking.
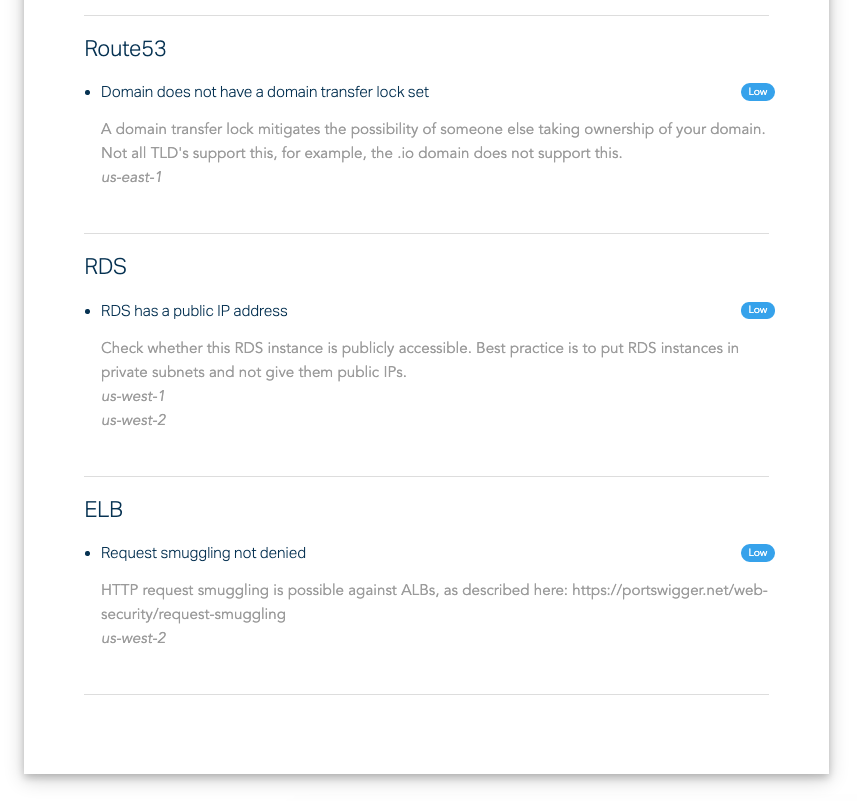
Using similar methodology to the AWS Trusted Advisor, the AWS best practice compliance report is also automatically generated when you connect your AWS accounts to Hava.
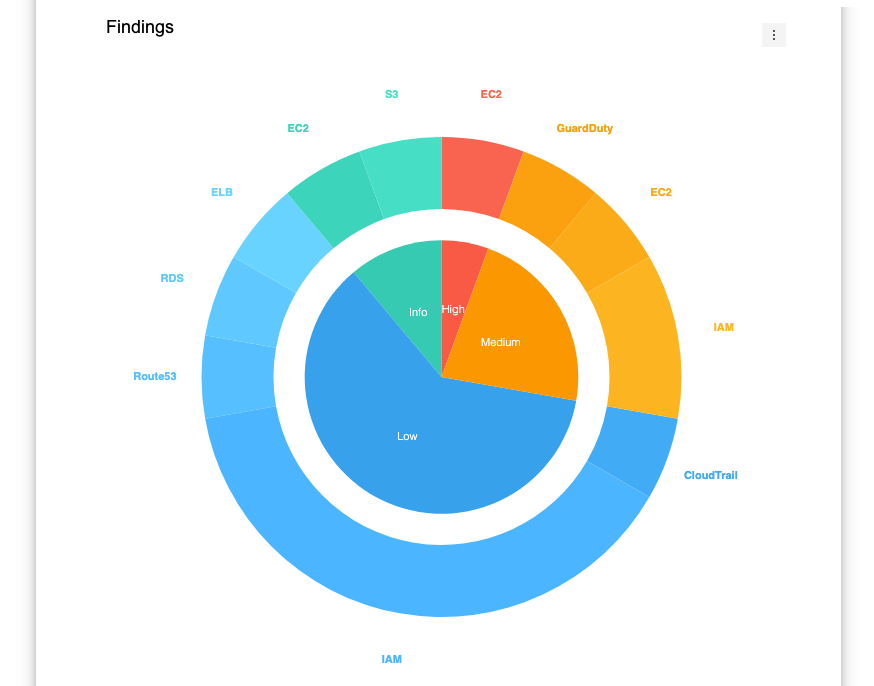
As well as reporting and graphing Region Usage, Resources by Region, Total Resources, IAM users and Roles in use, the compliance report will also detail findings broken down by severity and suggest how to resolve the issues found.
![]()
Are you concerned about the time it takes to onboard new cloud engineers or dev teams? Or are you concerned about the time it takes to get to grips with a new client's existing cloud configurations?
Us too! Before hava.io was created, we provided expert cloud consulting services to large organizations. The first question we always asked was "What does your infrastructure look like, what's running where and do you have up to date diagrams?" Invariably we were met with blank stares or presented with a set of partial, out of date documentation.
We would then spend days or weeks delving into consoles, documenting configuration settings and producing a current diagram so our team knew exactly what was going on and what we could improve.
There had to be a better way, a tool to automate this massive time-suck. There wasn't! So we built hava.io
If your organization is facing the same issues we were, try integrating hava into your client onboarding SOPs. You will save so much time and always have accurate diagrams and documentation on hand. Once connected your cloud documentation is always up to date and you have a permanent record of all the changes to your cloud infrastructure from the minute you connect hava.
Please take hava for a free test drive - all plans come with a 7 day free trial and are available in a convenient cloud based SaaS format or a custom Enterprise solution.
You can also utilize our real human chat in the bottom right of this page, email us or give us a call.
We look forward to hearing from you.