Some of the major reasons our client executives and management love hava.io include:
As a busy IT consultancy in Melbourne, we specialized in cloud infrastructure services providing leading enterprise clients with architecture, engineering and DevOps services.
Each time we took on a new client, the first question we asked was, what does your existing network topology look like now & do you have any up to date diagrams so we can see the state of play.
Generally, we were met with a blank stare and so began the painful process of trolling through consoles and settings for days and sometimes weeks to build a picture of what they had running and to document it as the starting point.

We knew the cloud-config data was accessible on the big 3 cloud providers. We also knew we had some pretty incredible coding talent leading our teams, so we decided to see if we could automate the process and build diagrams directly from the configuration data.
The significant investment in time and money required to build hava was daunting, but our management had a vision (and still does) and they could see the returns to our consulting division would pay off over and over as days and weeks of work were reduced to just minutes.
What did we solve
The list goes on and on. Hava provides so much more data and detail, it's hard to justify calling it a diagramming tool - it's so much more.

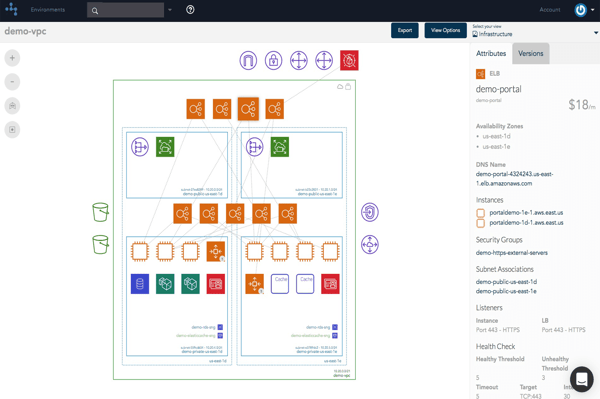
Once you connect Hava to your data sources (cloud accounts) we import the configuration data and render the infrastructure diagrams.
There are separate diagrams for different use cases.
Your team can export these diagrams at any time into your favorite drawing tool or to a JPG or PDF for inclusion in management reports.
The diagrams are updated every time a change is detected and the old version is stored in the archived config area. This means you can go back in time and pull documentation showing the state of play at any point in history, which is worth its weight in gold when something breaks or you get a PCI compliance, security or insurance audit.

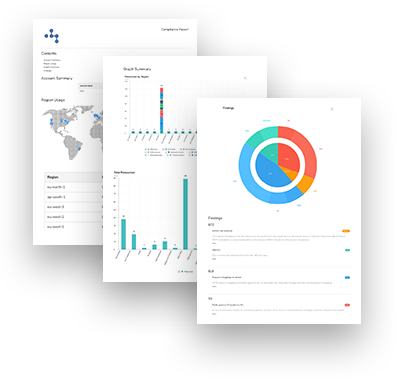
Alongside your interactive diagrams, Hava also has a reporting module that automatically builds reports related to your cloud environment.
The AWS compliance report, for instance, compares your environment configuration against AWS well-architected / best practice and reports resources and any adverse findings in a stylish management report format.

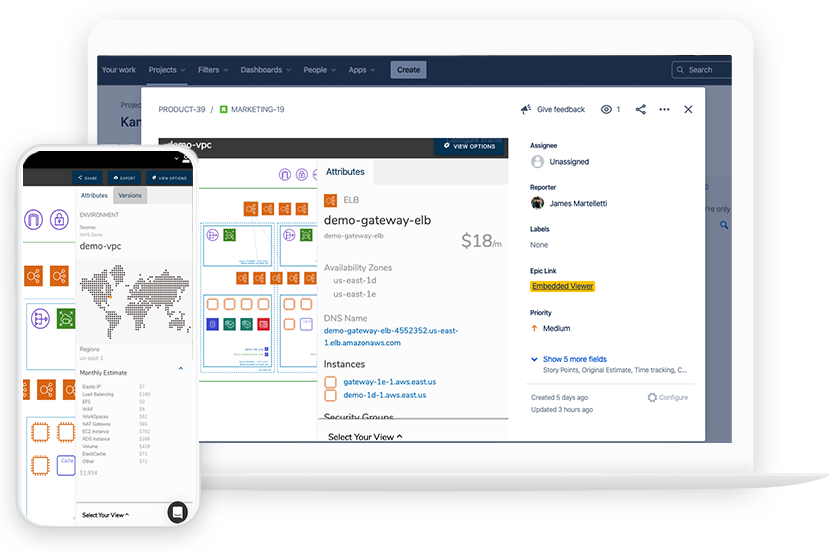
With Hava's built-in embeddable diagram viewer, you can place diagrams externally via an iFrame code snippet. No login is required to view the live, fully interactive diagrams.
Hava has a fully featured API that enables you to pull config data, fire sync requests and any perform number of tasks and functions.
The API has been used to do some quite complex tasks like
Hava is available in two formats. You can simply connect your cloud credentials to the cloud SaaS version at hava.io and you'll be producing elegant 100% accurate diagrams in minutes.
If you need a self-hosted Enterprise Solution, then have a chat with our sales/support staff and we can organize a discovery call to explore how we can best serve your organizational needs.
There's a chat dialogue at the bottom right of this page, or you can email us at sales@hava.io and we'll get back to you promptly.
Thanks for your interest in Hava automated cloud diagrams.