Unlocking Cloud Cost Efficiencies in 2024
Keeping control of your cloud costs is always important. Here are some tips to keep on top of your cloud computing budget in 2024.

Moving solutions to the cloud helps solve real world problems. It can be simple to get things set up quickly and provide the solution to your business needs fast.
Hosting your systems in the cloud makes it easier to make and deploy changes fast which can provide an easier method of gaining first mover advantage when new opportunities arise in your industry.
The downside is that sometimes with aggressive deployment activity, the supporting cloud infrastructure doesn’t come cheap. This can lead to unexpected bill shock from what appears to be cost blow outs. This can lead to questions from further up the management chain. They will want to know why costs have gone up when the move to the cloud was supposed to be cheaper than running everything in-house.
You’ll probably be asked for the costings. There’s a big chunk that’s production and mostly unavoidable, but what about the rest. How much are your development or unused old test environments adding to the cloud bill?
One big slab of billing information tells you what you need to pay, what services you are paying for but not necessarily exactly what environments, infrastructure or applications attracted the bulk of the charges.
If you are using one of the three main cloud platforms, you are probably somewhat familiar with the native billing/costs consoles built into AWS, Azure and GCP
All three platforms have billing consoles that allow you to manage your billing accounts and projects. It provides a central location to view your usage and costs, set budgets based on tags and set alerts when spending is approaching set budgets.
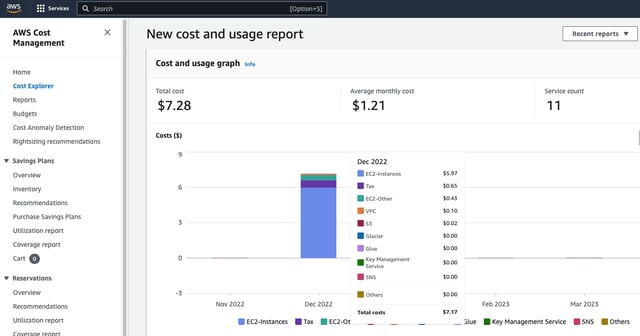
The three management consoles do a number of things well. They are easy to use and navigate, providing clear and concise information about your billing activity based on resource types. They also offer a wide range of features to help you manage your costs, including budgets, alerts, and exportable reports.
On the whole they are:
Easy to use: The cloud billing consoles are very easy to use, even for users with no prior experience with budgets or billing. The interfaces are clean and well-organized, and all of the important information is easy to find.
Comprehensive reporting: All three billing interfaces provide comprehensive reporting on your billing activity. You can view detailed reports on your usage, costs, and budgets.
Flexible budgeting: The billing consoles allow you to create flexible budgets to track your spending. You can set budgets for individual projects or for your entire organization using tags to group together costs. Setting up tags for projects, applications or departments lets you know from a macro level who is spending your cloud budget.
Overall, the Billing Console offerings from all three major cloud providers are a powerful tool that can help you manage your cloud spend.
All three platforms include some form of:
Budgets: Budgets allow you to track your spending and set alerts to notify you when you are approaching or exceeding your budget limits.
Alerts: Alerts allow you to receive notifications when your spending exceeds a certain threshold.
Reports: Reports provide detailed information about your billing activity. You can view reports on your usage, costs, and budgets.
Exportable data: You can export your billing data to a variety of formats, including CSV, JSON, and XML. This allows you to import the data into other applications for further analysis.
A cloud billing console is a valuable tool that can help you manage your billing activity. It is easy to use, provides comprehensive reporting, and offers a variety of features to help you control your costs but they can be difficult to decipher when it comes to granular details and context around how each of the services and resource types are being used.
Then we have any number of third party cost management applications to help monitor cloud spend.

Cloudability is a cloud cost management and optimization service that helps organizations understand, optimize, and control their cloud spend. It does this by providing a single view of cloud usage and costs, as well as a variety of features to help organizations identify and eliminate unnecessary costs.
In terms of monitoring cloud spend, Cloudability offers a number of features, including:
Cost tracking: Cloudability tracks cloud usage and costs across all public cloud providers, providing a single view of your cloud spend.
Budgeting and forecasting: Cloudability allows you to set budgets and track your spending against those budgets. You can also use Cloudability to forecast your future cloud spend.
Cost optimization: Cloudability offers a variety of features to help you identify and eliminate unnecessary costs. These features include cost analysis, right-sizing recommendations, and cloud spend alerts.
Cloudability can help organizations to save money on their cloud spend by providing them with the visibility and tools they need to understand, optimize, and control their cloud costs.
Some of the benefits of using Cloudability to monitor cloud spend may include:
Reduced costs: Cloudability can help you to reduce your cloud spend by identifying and eliminating unnecessary costs.
Improved visibility: Cloudability provides you with a single view of your cloud usage and costs, which can help you to better understand your cloud spend.
Increased control: Cloudability gives you the tools you need to control your cloud spend, such as budgets, alerts, and cost optimization features across multiple vendors.
CloudHealth by VMware is a cloud management platform that provides organizations with a single view of their cloud resources, usage, and costs. It helps organizations to optimize their cloud resources, reduce costs, and improve security.
CloudHealth by VMware offers a number of features to help organizations monitor their cloud spend, including:
Cost tracking: CloudHealth by VMware tracks cloud usage and costs across all public cloud providers, providing a single view of your cloud spend.
Budgeting and forecasting: CloudHealth by VMware allows you to set budgets and track your spending against those budgets. You can also use CloudHealth by VMware to forecast your future cloud spend.
Cost optimization: CloudHealth by VMware offers a variety of features to help you identify and eliminate unnecessary costs. These features include cost analysis, right-sizing recommendations, and cloud spend alerts.
CloudHealth by VMware can help organizations to save money on their cloud spend by providing them with the visibility and tools they need to understand, optimize, and control their cloud costs.
CloudHealth by VMware helps:
Reduce costs: CloudHealth by VMware can help you to reduce your cloud spend by identifying and eliminating unnecessary costs.
Improved visibility: CloudHealth by VMware provides you with a single view of your cloud usage and costs, which can help you to better understand your cloud spend.
Increased control: CloudHealth by VMware gives you the tools you need to control your cloud spend, such as budgets, alerts, and cost optimization features.
Cost tracking: CloudHealth by VMware tracks cloud usage and costs across all public cloud providers, including Amazon Web Services (AWS), Microsoft Azure, and Google Cloud Platform (GCP). This provides you with a single view of your cloud spend, which can help you to better understand your costs and identify areas where you can save money.
Budgeting and forecasting: CloudHealth by VMware allows you to set budgets and track your spending against those budgets. You can also use CloudHealth by VMware to forecast your future cloud spend. This can help you to avoid overspending and ensure that you are on track to meet your budget goals.
Cost optimization: CloudHealth by VMware offers a variety of features to help you identify and eliminate unnecessary costs. These features include cost analysis, right-sizing recommendations, and cloud spend alerts. Cost analysis helps you to understand where your costs are coming from and identify areas where you can save money. Right-sizing recommendations help you to ensure that you are using the right amount of resources for your workloads. Cloud spend alerts notify you when your spending exceeds a certain threshold.
Dynatrace is an enterprise software company that provides full-stack observability for software-defined businesses. Dynatrace Cloud Spend Monitoring is a solution that helps organizations to optimize their cloud spend by providing visibility into their cloud usage and costs.
Dynatrace Cloud Spend Monitoring offers a number of features to help organizations monitor their cloud spend, including:
Cost tracking: Dynatrace Cloud Spend Monitoring tracks cloud usage and costs across all public cloud providers, providing a single view of your cloud spend. Dynatrace Cloud Spend Monitoring tracks cloud usage and costs across all public cloud providers, including Amazon Web Services (AWS), Microsoft Azure, and Google Cloud Platform (GCP). This provides you with a single view of your cloud spend, which can help you to better understand your costs and identify areas where you can save money.
Budgeting and forecasting: Dynatrace Cloud Spend Monitoring allows you to set budgets and track your spending against those budgets. You can also use Dynatrace Cloud Spend Monitoring to forecast your future cloud spend.
Cost optimization: Dynatrace Cloud Spend Monitoring offers a variety of features to help you identify and eliminate unnecessary costs. These features include cost analysis, right-sizing recommendations, and cloud spend alerts.
There are lots more options to choose from including
RightScale: RightScale is a cloud management platform that helps organizations optimize their cloud spend, resources, and risks. It does this by providing a single view of cloud usage and costs, as well as a variety of features to help organizations identify and eliminate unnecessary costs.
CloudCheckr: CloudCheckr is a cloud management platform that helps organizations optimize their cloud spend, resources, and risks. It does this by providing a single view of cloud usage and costs, as well as a variety of features to help organizations identify and eliminate unnecessary costs.
CloudSigma: CloudSigma is a cloud computing provider that offers a variety of cloud services, including Infrastructure as a Service (IaaS), Platform as a Service (PaaS), and Software as a Service (SaaS). CloudSigma also offers a cloud spend management tool that helps organizations track their cloud usage and costs.
Cloudyn: Cloudyn is a cloud management platform that helps organizations optimize their cloud spend, resources, and risks. It does this by providing a single view of cloud usage and costs, as well as a variety of features to help organizations identify and eliminate unnecessary costs.
CloudHealth Insights: CloudHealth Insights is a cloud management platform that helps organizations optimize their cloud spend, resources, and risks. It does this by providing a single view of cloud usage and costs, as well as a variety of features to help organizations identify and eliminate unnecessary costs.
CloudZero: CloudZero is a cloud management platform that helps organizations optimize their cloud spend, resources, and risks. It does this by providing a single view of cloud usage and costs, as well as a variety of features to help organizations identify and eliminate unnecessary costs.

Sure it’s great knowing how much a particular service type is costing in the grand scheme of things, or what project or department was tagged so the spend can be apportioned to their budget.
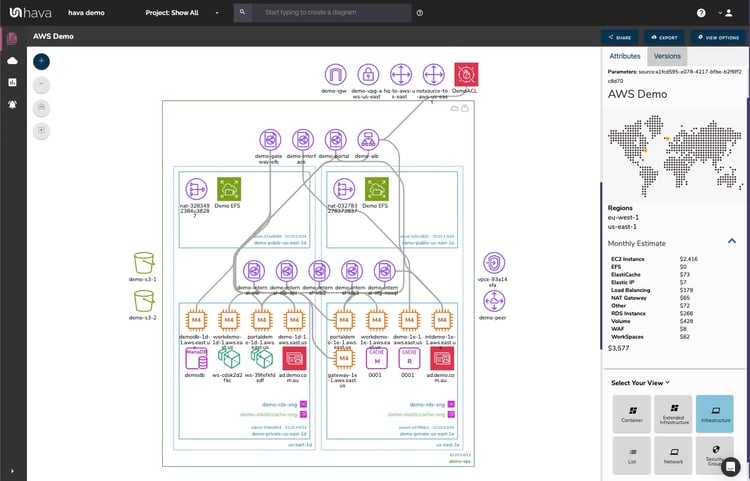
The real insight lies in the context behind each resource. Knowing exactly how each resource fits into your environment, how it is used and what it is connected to gives you a better perspective on how the resource is used, or indeed if you need it at all.
This is where the power of cloud cost visualization comes into play.
Knowing the context behind each of the resources being reported in a cloud cost monitoring application can provide a number of advantages, including:
Improved visibility: By understanding the context behind each resource, you can gain a better understanding of how your cloud resources are being used. This can help you to identify areas where you may be able to reduce costs or improve efficiency.
Increased control: By understanding the context behind each resource, you can gain more control over your cloud spend. This can help you to avoid overspending and ensure that you are meeting your budget goals.
Better decision-making: By understanding the context behind each resource, you can make better decisions about your cloud usage. This can help you to optimize your cloud resources and get the most out of your cloud investment.
Here are some specific examples of how knowing the context behind each resource can be beneficial:
Identifying underutilized resources: If you know the context behind each resource, you can identify resources that are not being used. This can help you to eliminate resources that you are not using and save money. Sure the monitoring application says you can resize that RDS instance, but what is it actually used for and what environment is it running in.
Finding cost-saving opportunities: If you know the context behind each resource, you can identify opportunities to save money on your cloud spend. For example, you may be able to reduce costs by right-sizing your resources or by moving to a more cost-effective service type or cloud provider. There is almost always a resource instance running that isn’t really required. Sure the monitoring app says it’s in use, because you are paying for it. But who is using it and why?
Explaining Cost Increases: Why are these new resources appearing? Did the organisation take an architectural decision to start using this new type of service, or is someone somewhere making decisions and is unaware of the impact to the bottom line.
Cloud Estate Rationalisation: These resources aren’t tagged as production. Can we just switch them off? Before you do, taking a look at the context, what environments are they running in, what is that infrastructure used for can often prevent issues arising or a lengthy restore and recovery process should you remove some critical resources. At the very least, with some context you’ll confirm the resource is ok to nuke.
There are a number of roles where bringing context to your cloud spend monitoring data can be a massive advantage.
Managed Service Providers
When you are running cloud infrastructure on behalf of customers, you are going to get questions, especially during a bill-shock event.
What was to blame, who was to blame, your clients will want answers.
Professional Services
Pro services teams will face the same challenges. The customer will want to know what they have running and why it costs so much. They will most likely request a review to show them all the expensive resources and why they exist. Is it all really necessary?
DevOps / Ops
Whether costs spike suddenly or gently simmer away until they are too hot to handle, at some point finance, the client or the suits on the top floor are going to start asking questions and the Ops manager will be directly in the cross-hairs when answers are needed.
Audit / Finance
During an audit or cost reduction strategy planning, those concerned with finance will need to know why things have changed and what events or timeline the expensive changes relate to.
ITSM
Keeping your CMDB in order and having changes recorded over time gives you a line of sight on changes in your environments. This information is not only critical for service and support purposes, but also essential to track changes and identify the potential causes of issues related to cost reduction activities.
Hava provides visual context to your cloud infrastructure through the automated generation of interactive environment diagrams. These diagrams stay up to date on auto pilot and record changes to infrastructure that are accessible via a retained version library of superseded diagrams.
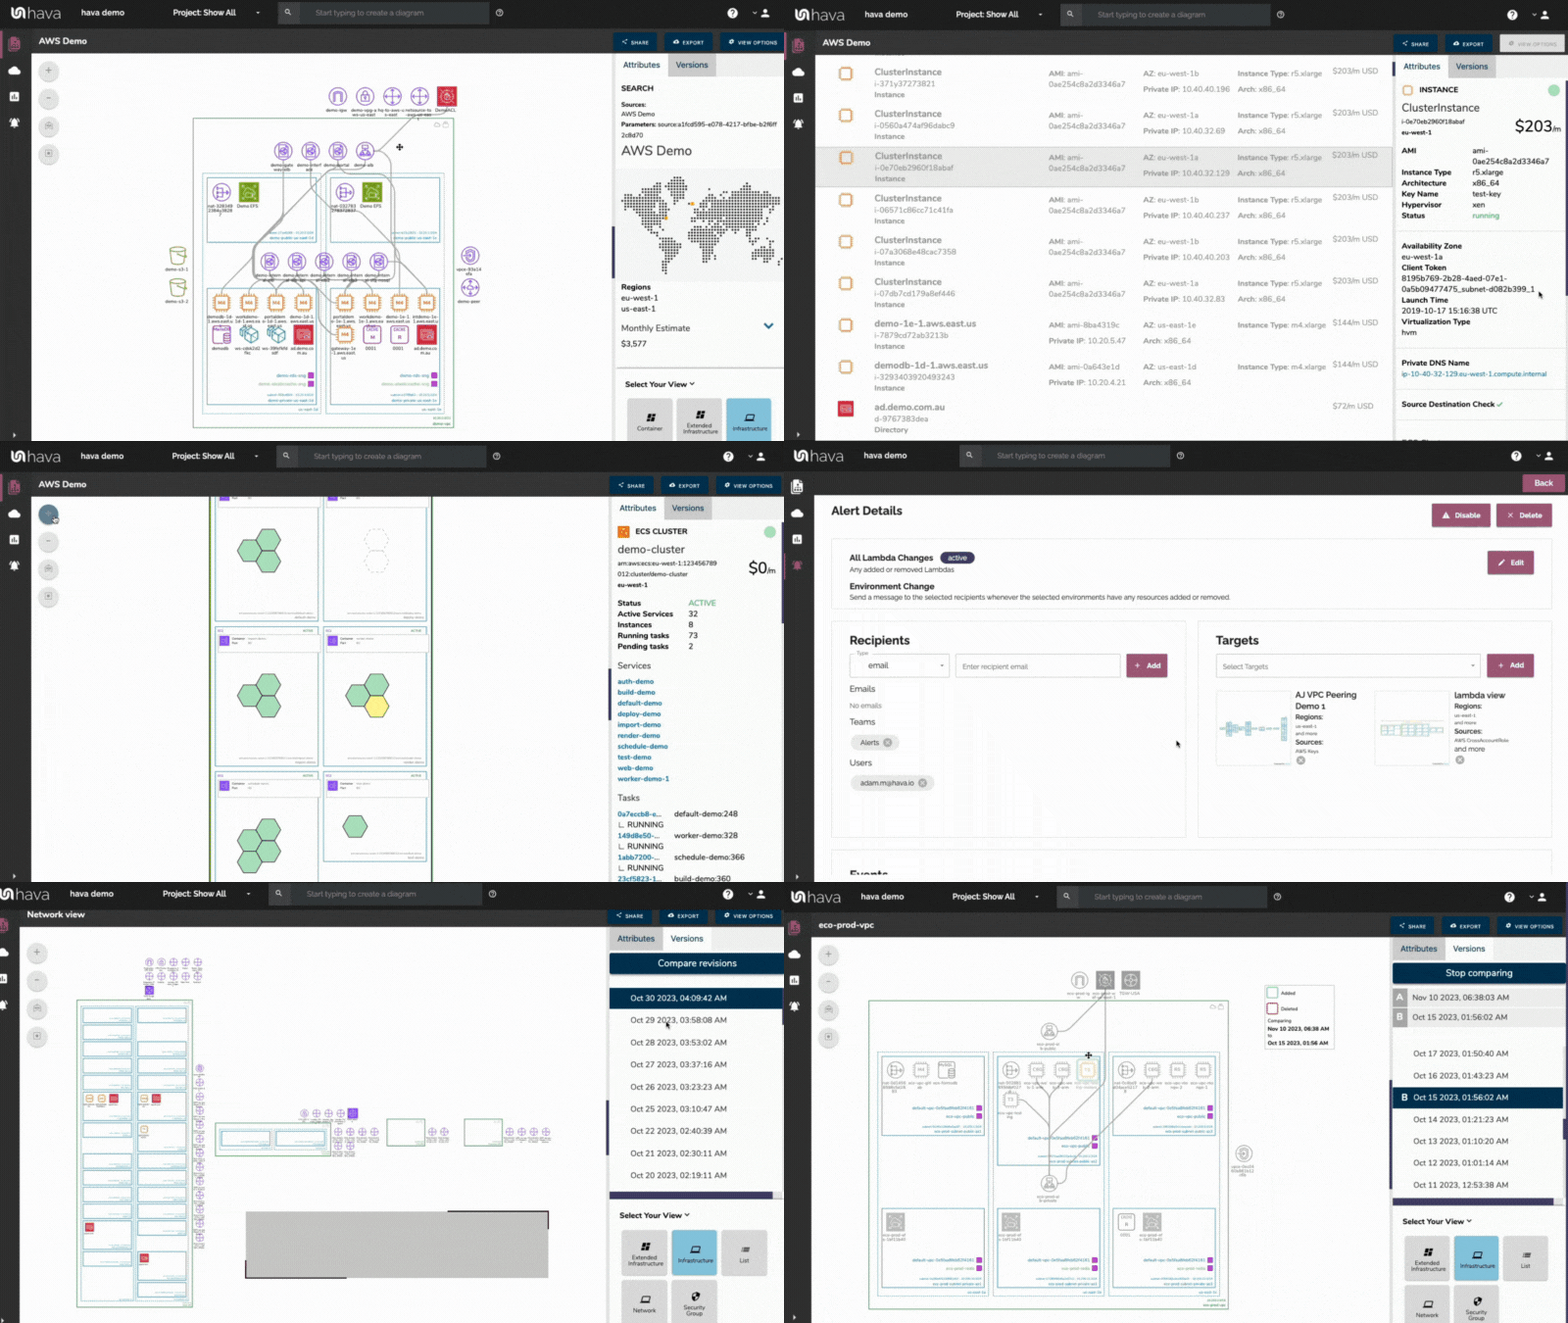
This provides the basis of Hava’s ability to greatly enhance your FinOps capabilities in the previously mentioned areas by providing added context when you need to review infrastructure changes or decide the fate of expensive resources.
Can Enhanced Cloud Cost Visualization capabilities with context help MSPs?
When cost alerts start pinging away in your cost monitoring platforms or your budgets start to blow out, you can use Hava to zero in on the culprit and provide the required context around that particular resource. What environment is it running in, how is it accessed and what has changed.
You can respond by creating custom views using tags to show everything associated with a particular application or project and a history of the changes. You can then provide the customer with a link to the diagram showing what is running, what you have reviewed and what they should consider next.
You can also get one step ahead of the game by producing custom diagrams highlighting all the similar resources across the client’s entire portfolio of accounts and use the export features to create a trending costs report for all their environments so they know what to expect.
You can leverage Hava’s architectural monitoring alerts to keep close tabs on all the cloud accounts you have under management. When a new service or changes are made there is almost certainly a cost implication. You can set alerts to go to both you and your clients to let them know what to expect when the next cloud invoice arrives.
Can cloud cost visualization help Professional Services?
When costs have gone up and the client wants a review, using Hava you can provide current and previous infrastructure visualization for all their running environments.
You can use Hava’s list view to show all running resources in each virtual network sorted from the most expensive so they can see with granular detail exactly what is costing what. This is a great starting point to explain what is going on and to also provide a starting point for reviewing potential cost savings.
When you take on a new client and commence fixing poorly designed infrastructure, costs will inevitably change. Using Hava diagrams, you can show the client exactly what is changes and what impact those changes are likely to have on their cloud spend, even though the bill won’t drop for another month.
You can use Hava’s deep search function to identify resources without a specific tag. So if all the resources in a project should be tagged with a specific tag, you can surface all the resources that are not correctly tagged. This not only allows you to find outliers that may not be required (quick win) but also ensure costs for a particular resource are attributed to the correct department or project depending on how you have your billing console set up.
The ability to find completely untagged resources is also under development and should be available soon.
You can also leverage custom diagrams to detail expensive resource types if you want to explain to customers how they can modernize infrastructure and retire some tech debt.
Can DevOps / Ops benefit?
Integrating Hava API calls into your CI/CD pipeline runs can allow you to pull back diagrams and costed list views of the most expensive resources being deployed. While they are mostly expected, sometimes deploying expensive resources types that lead to cost blow outs need to be reviewed. Having the before and after picture can give context to the scale of the change so someone can review if the changes need further investigation.
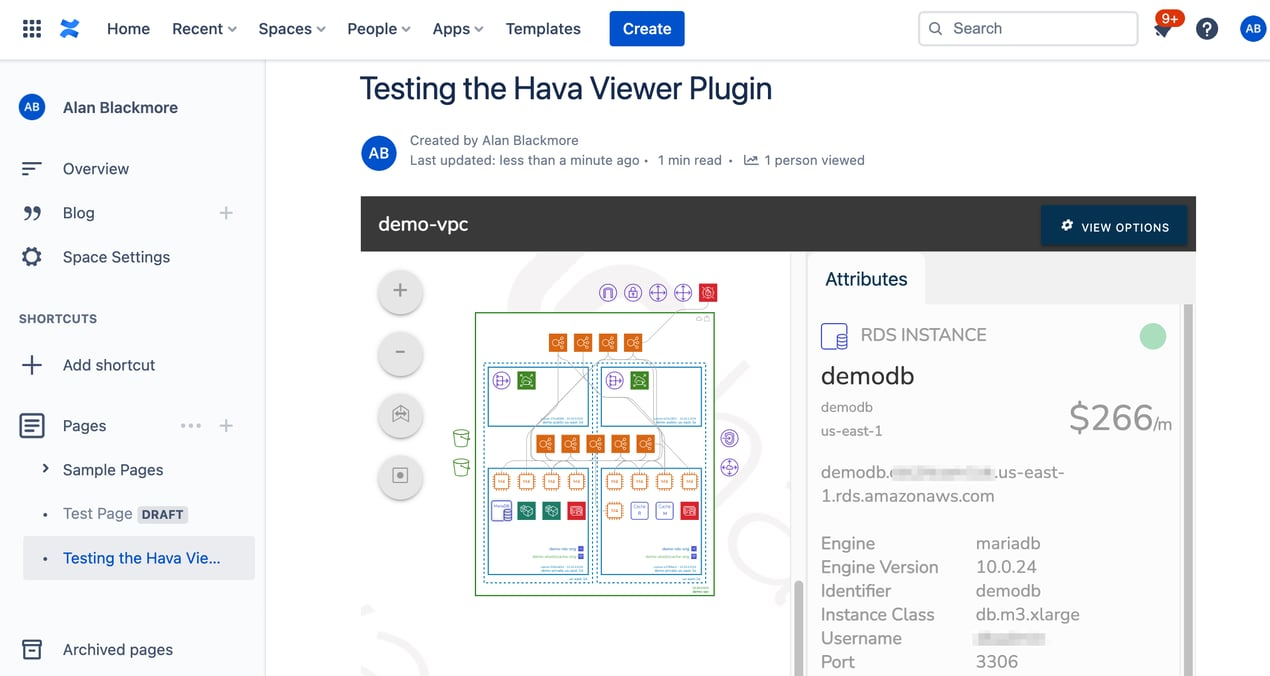
You can also set up a dedicated FinOps wiki to hold embedded diagrams as changes are made. Your Ops Manager can then easily access the audit trail of changes and be one step ahead of the inevitable “why has our AWS bill increased” questions.
Can Audit / Finance benefit from bringing context to your cloud costs?
When you are tracking down jumps in cloud spend and you just use cloud billing, you are most likely faced with two lump sums. Last month RDS spend was $10k, this month it was $15k!
What happened?
With the context provided by Hava’s continuous monitoring you can easily find out.
By either reviewing the infrastructure diagrams individually or creating a custom view of all your RDS instances onto a single diagram you can drill into the versioning of the associated infrastructure views to see exactly what changed when. See what was added or what specifications changed that could have caused the spike in costs.
Can ITSM benefit from improved cloud cost visualization?
You can link Hava diagrams to your service desk software via API, integrations or embedded diagrams to see the changes over time.
You can use the data to enrich your CMBD entries with any of the cost or metadata captured by Hava.
When changes are requested your team will be able to demonstrate not only the impact on non production environments, but you will have demonstrable data to indicate the actual change in the cost of your production environment once the changes are deployed.
You can also establish an “Architectural Decision Record” and use Hava diagrams to record the history of changes to your production environments over time.
Overall, knowing the context behind each resource in conjunction with a cloud cost monitoring application can provide you with a number of benefits, including improved visibility, increased control, and better decision-making.
If you are using a cloud cost monitoring application, we encourage you to take the time to understand the context behind each resource. This will help you to get the most out of your cloud spend and make more informed decisions when you are looking to reduce your cloud costs.
You can get started today, learn more using the button below.
Keeping control of your cloud costs is always important. Here are some tips to keep on top of your cloud computing budget in 2024.
Cloud Cost monitoring is essential for keeping control of your cloud spend. Sadly most solutions lack enough context around costly resources and what...
Monitor your AWS, GCP and Azure cloud spend with hava.io At a glance estimate of your cloud configuration costs with a resource by resource detailed...