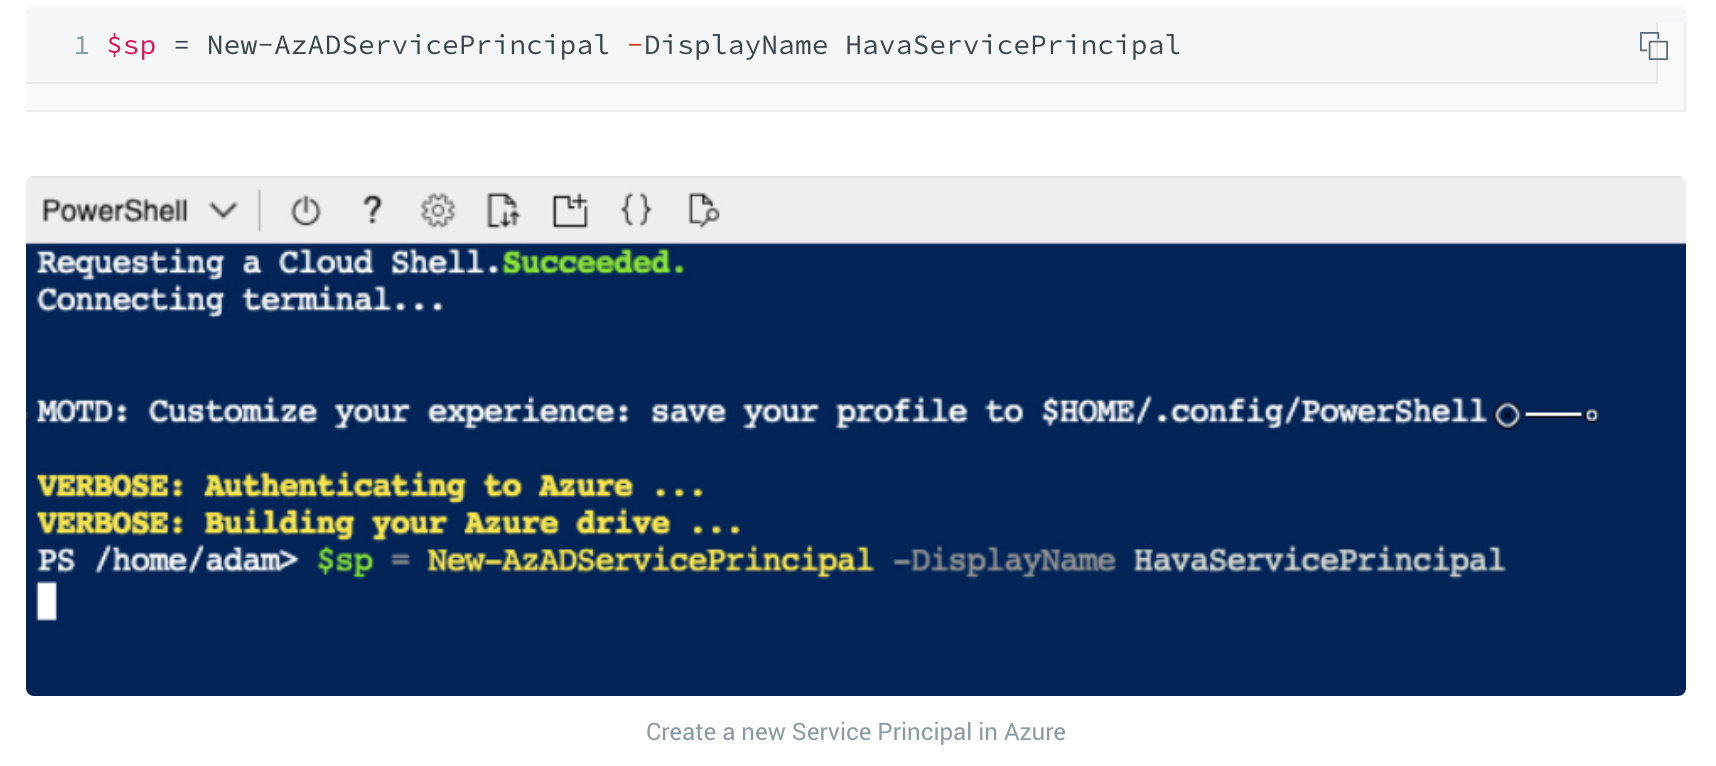
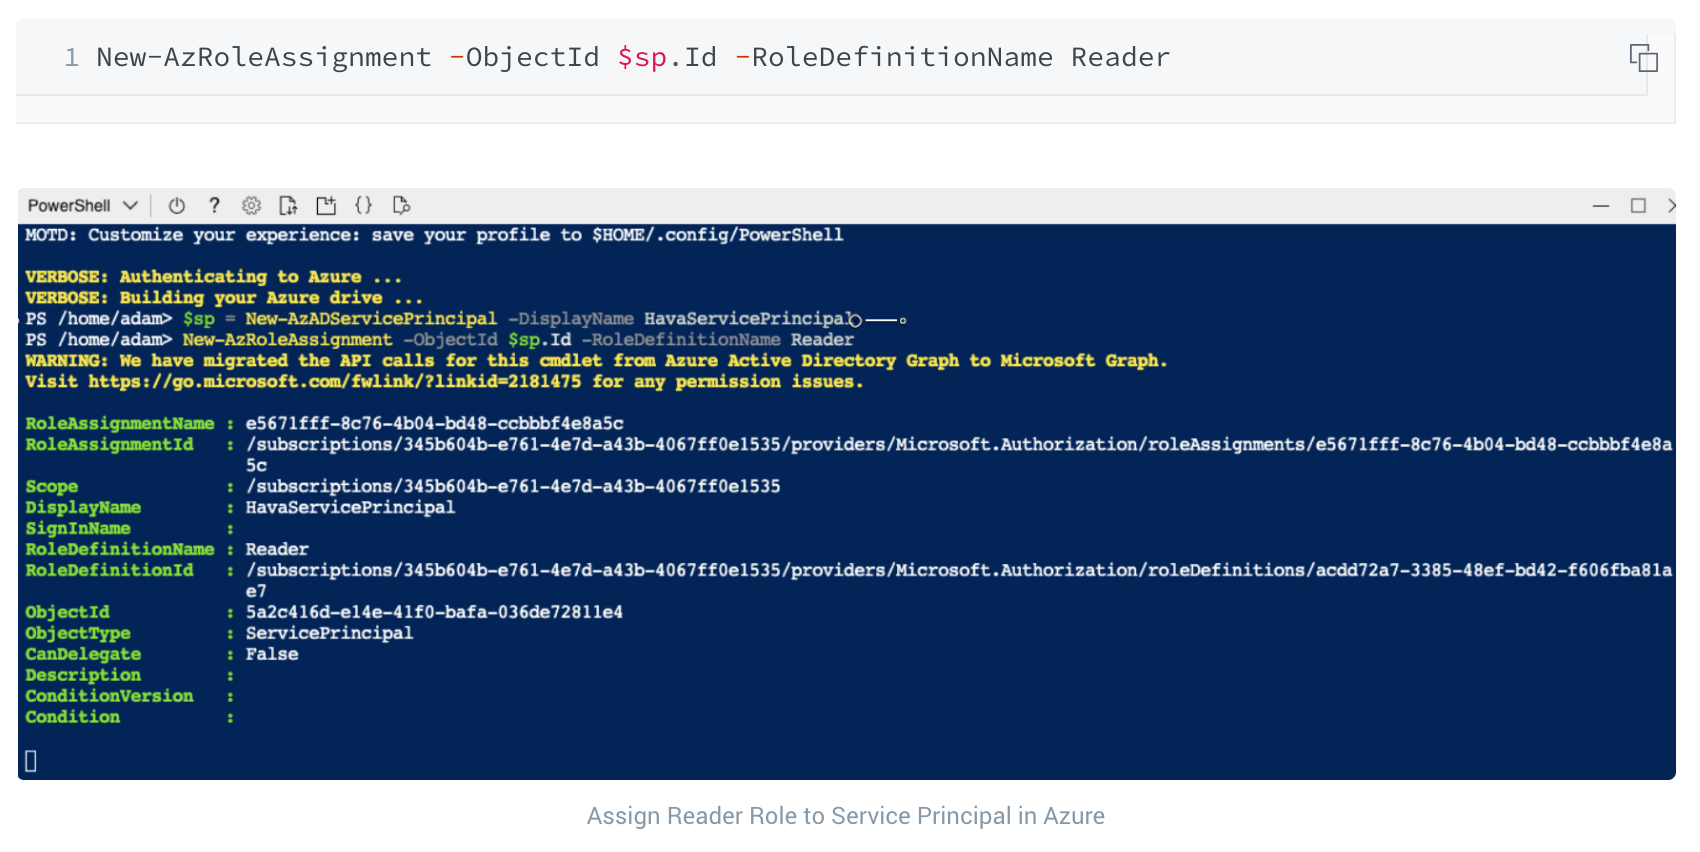
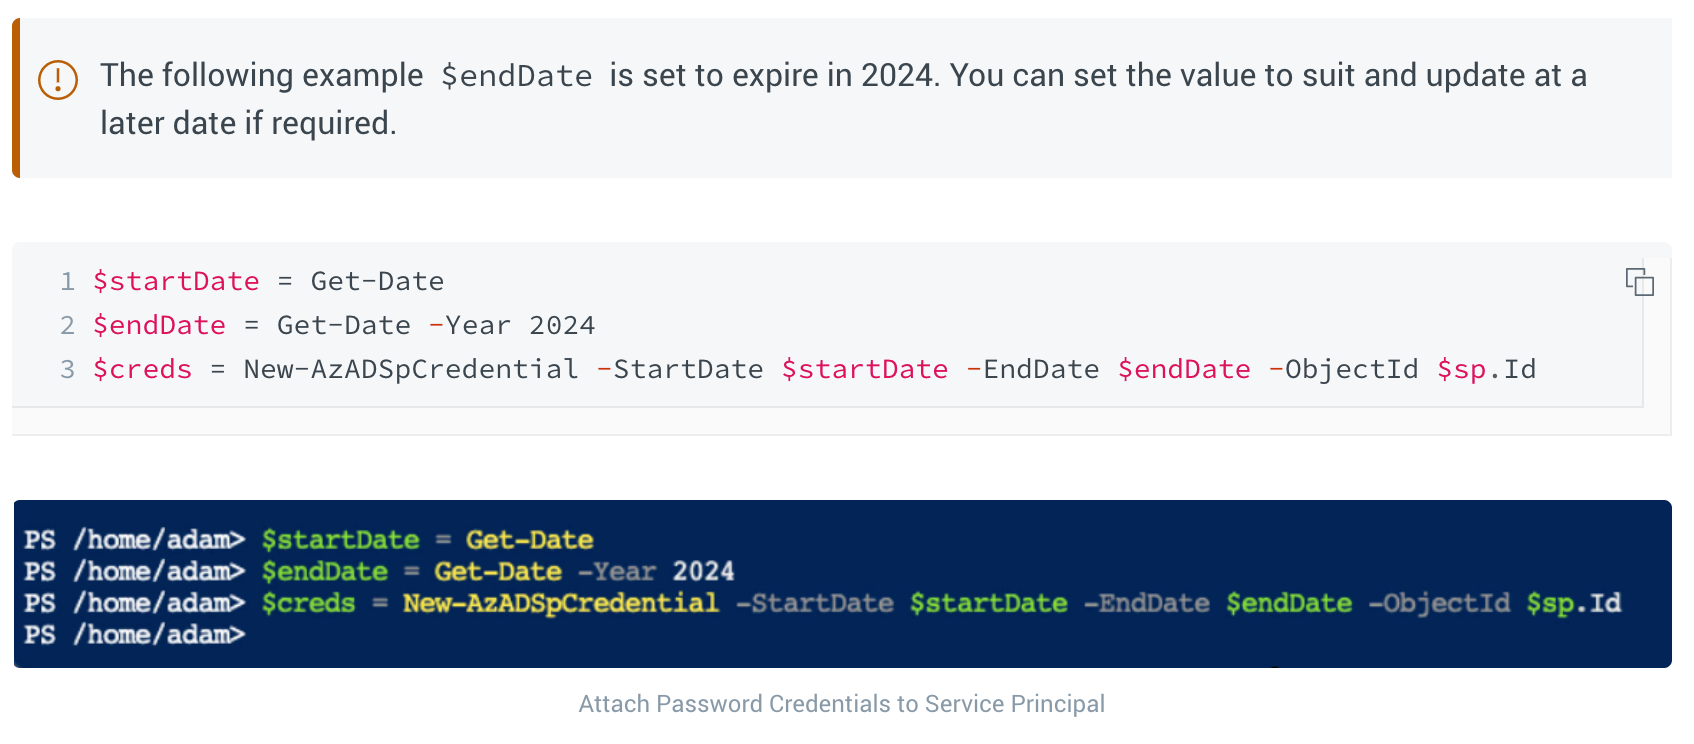
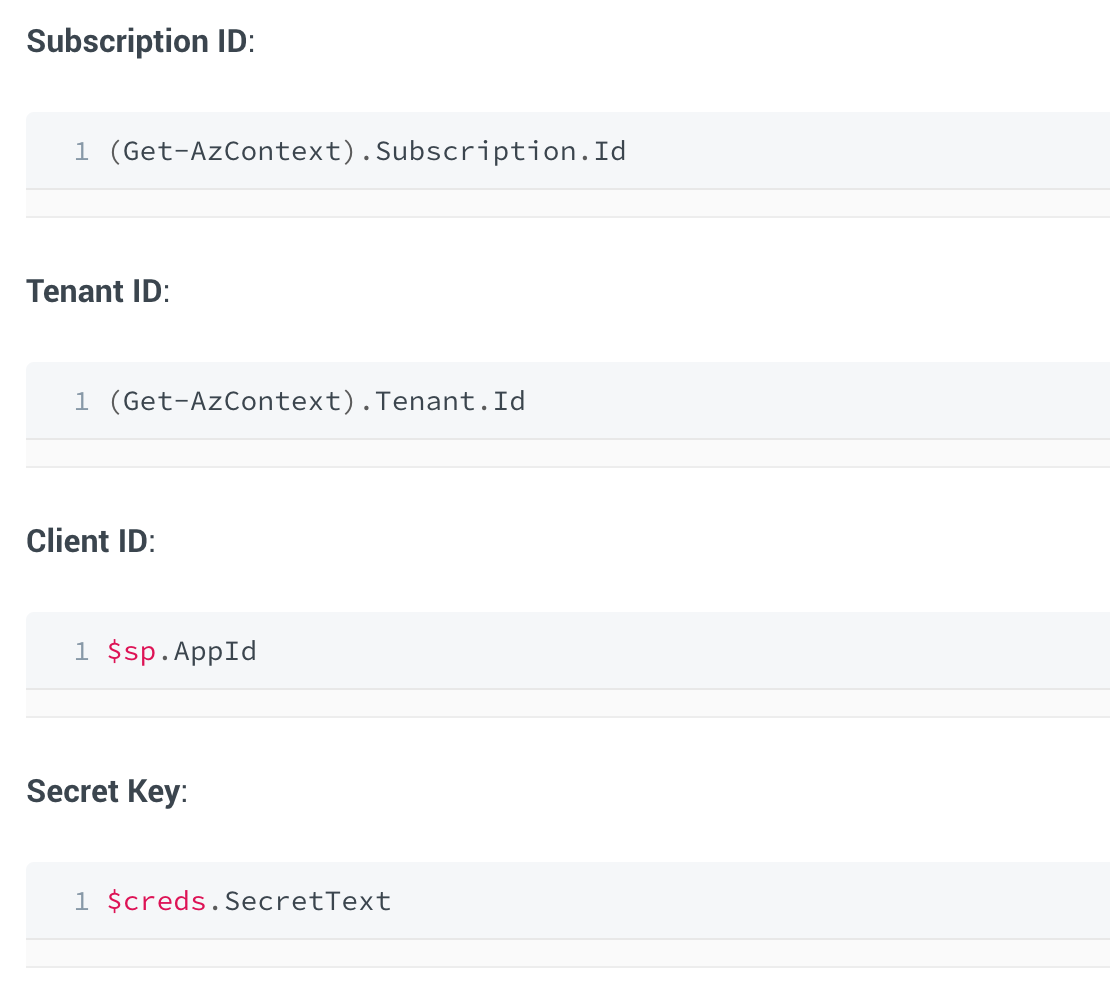
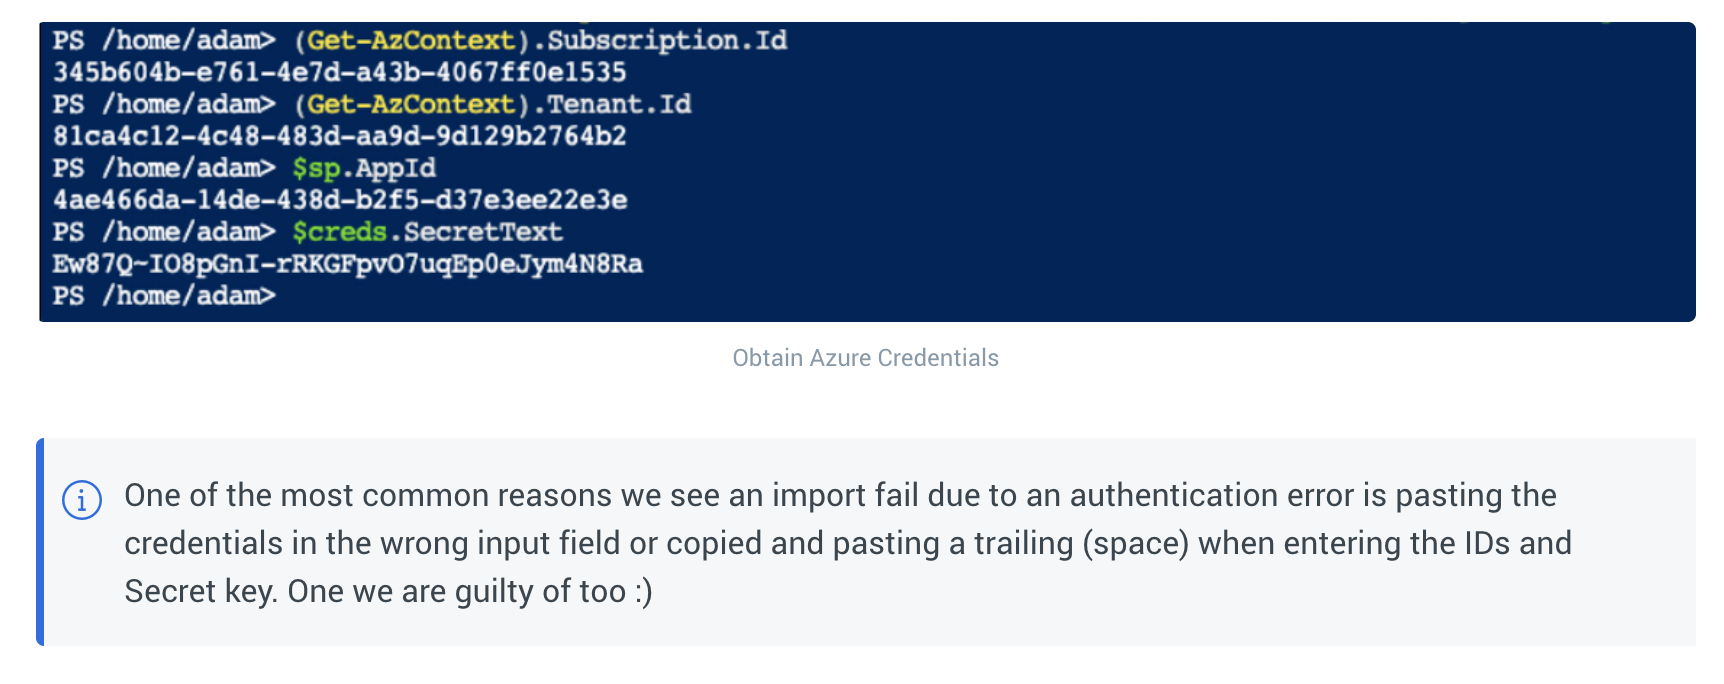
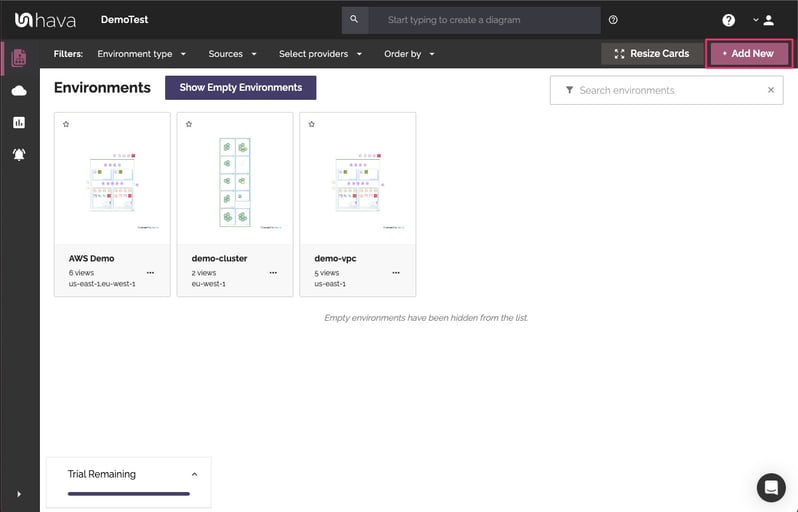
Once you have the required credentials, you can log in to Hava which will open up the environments screen. You then select "Add Environments"
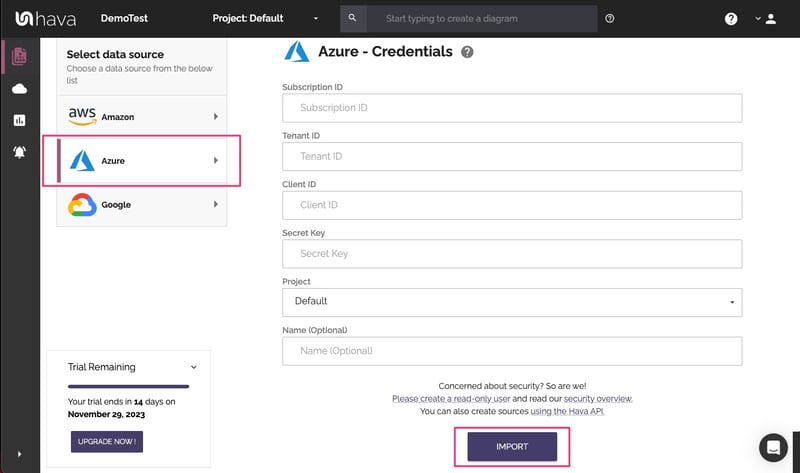
Click on the "Azure" Tab and enter the credentials you have just gathered from your Azure PowerShell.
Hava will import your Azure configuration metadata, layout the diagram and add an environment tile to the Hava "Environments" screen. From this point Hava will continually sync with Azure and log any configuration changes, so you always have an accurate visual representation of your Azure Environment on hand when you need it.
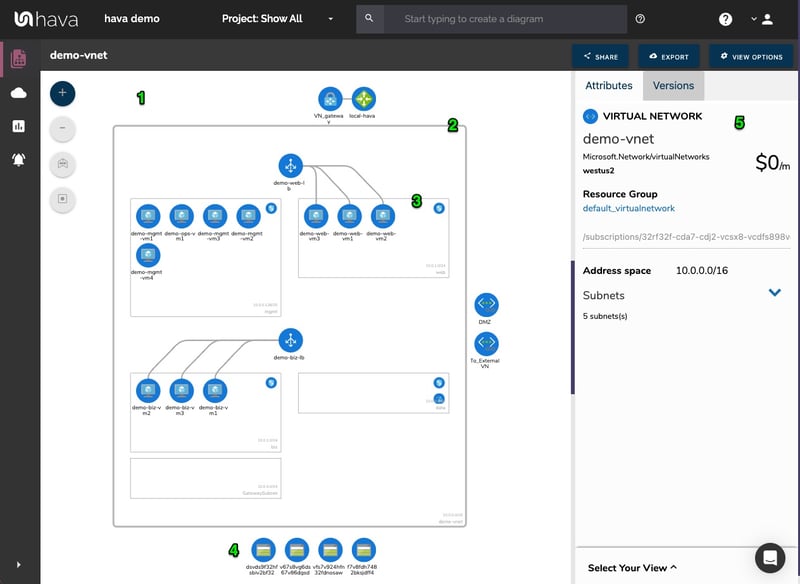
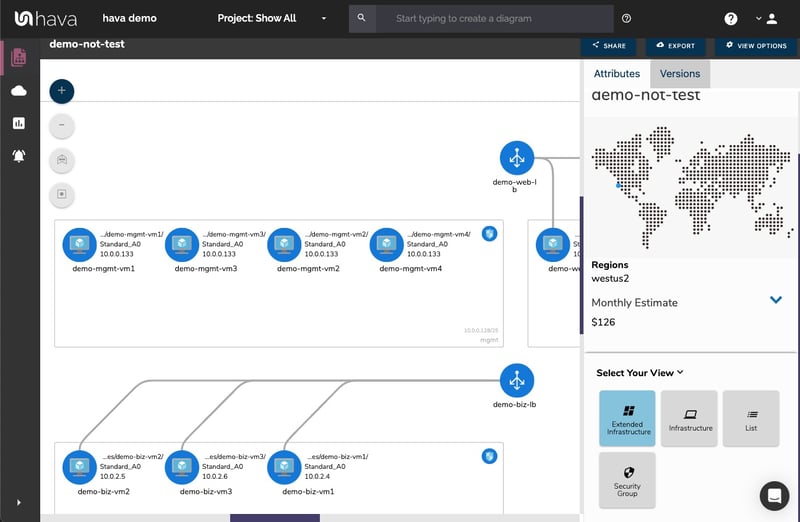
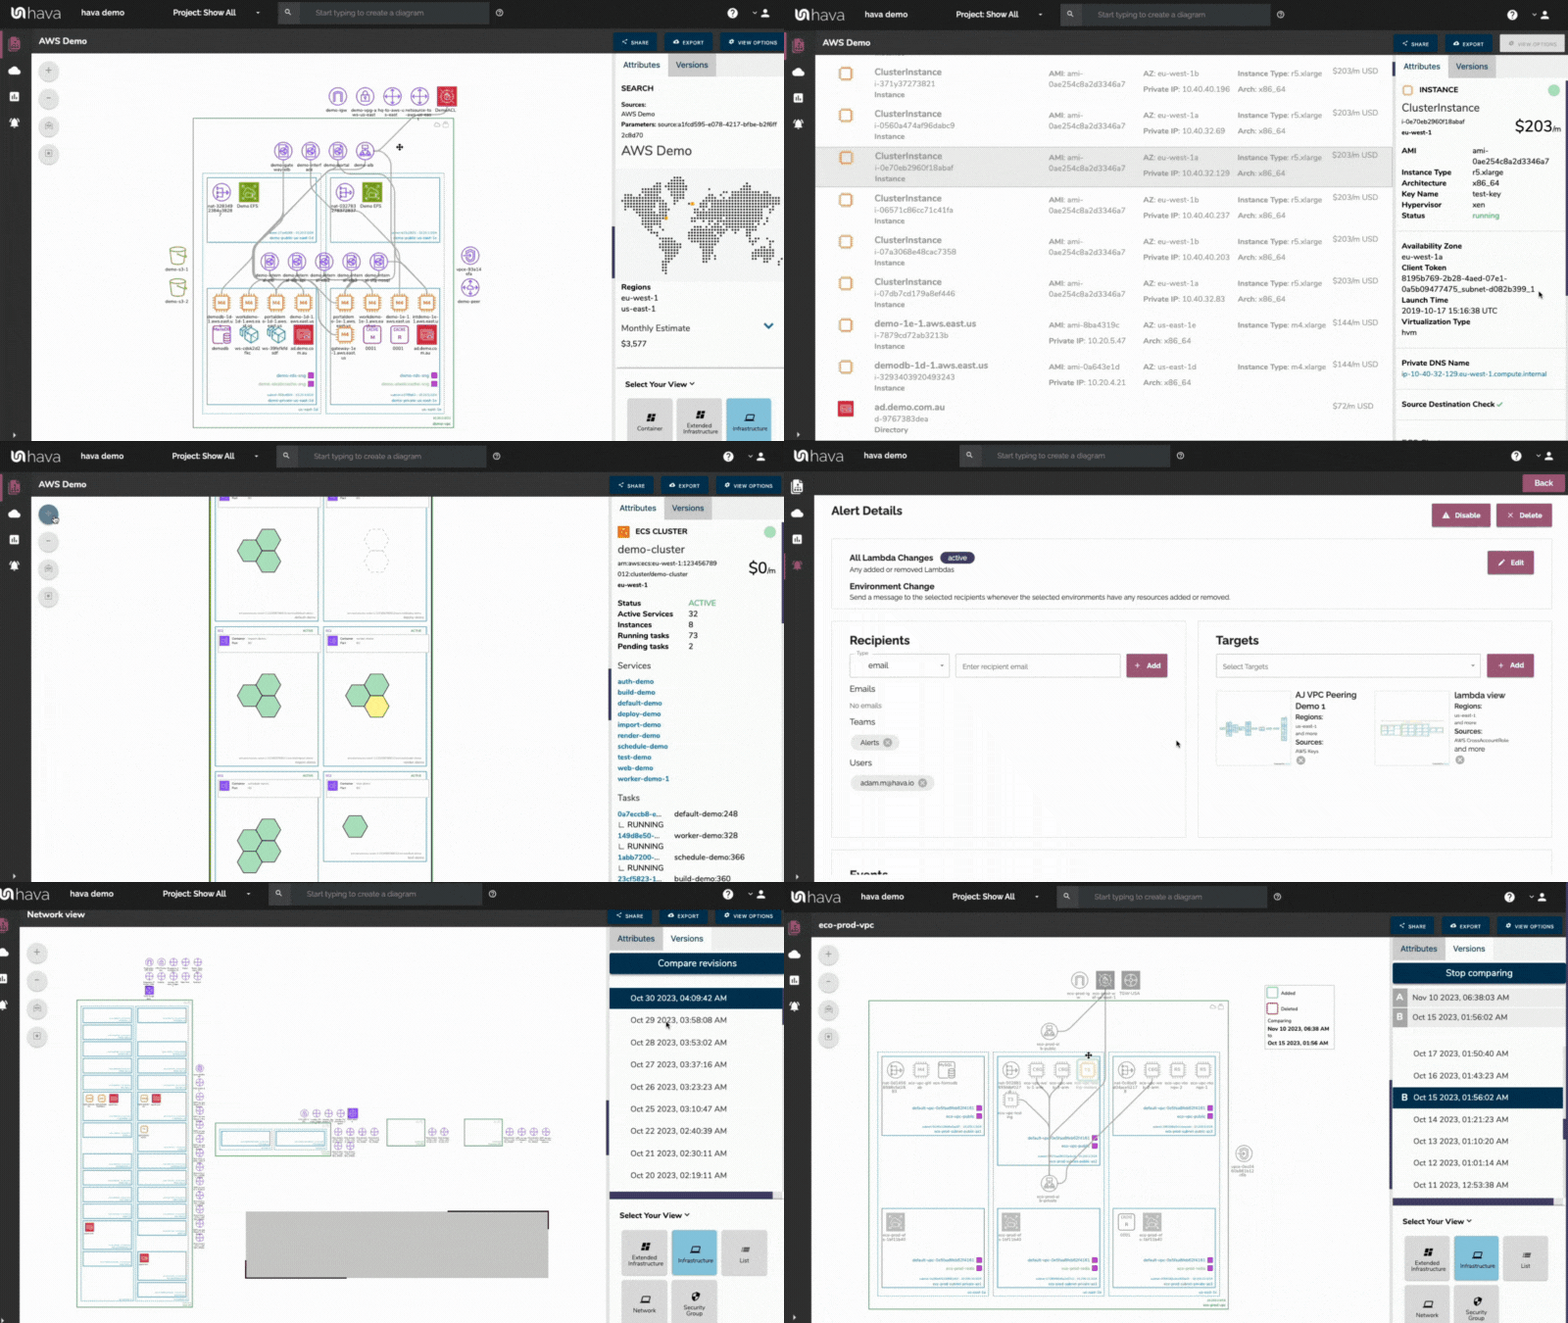
The diagrams produced are logically laid out by resource group which contain your subnets running in virtual networks. All of the resource metadata isn't placed on the diagram, but is displayed in a contextual attribute pane to the right hand side of your infrastructure diagram.
Moving the metadata for individual resource instances from the diagram canvas to the side panel keeps the diagram uncluttered, but allows you to select the interactive elements of the diagram, like a virtual network, subnet or individual resources like gateways, load balancers, virtual machines, virtual network peering connections and storage accounts to see the related settings. All the metadata and settings are displayed alongside the diagram in the attribute pane and are contextual to the currently selected element.
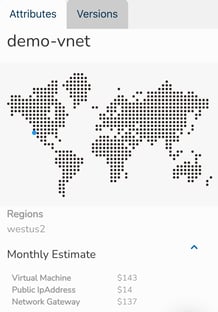
With nothing selected, the attribute side panel displays information about the entire Azure environment including a cost estimate breakdown.
One of the most powerful aspects of using Hava as part of your cloud management, build pipelines or DevOps strategy is that the software keeps track of any changes detected in your Azure infrastructure automatically.
Had you draw Azure diagrams yourself instead of automating the process, updating the diagrams to keep them accurate and up to date would be an even more times consuming exercise and you probably have better things to do.
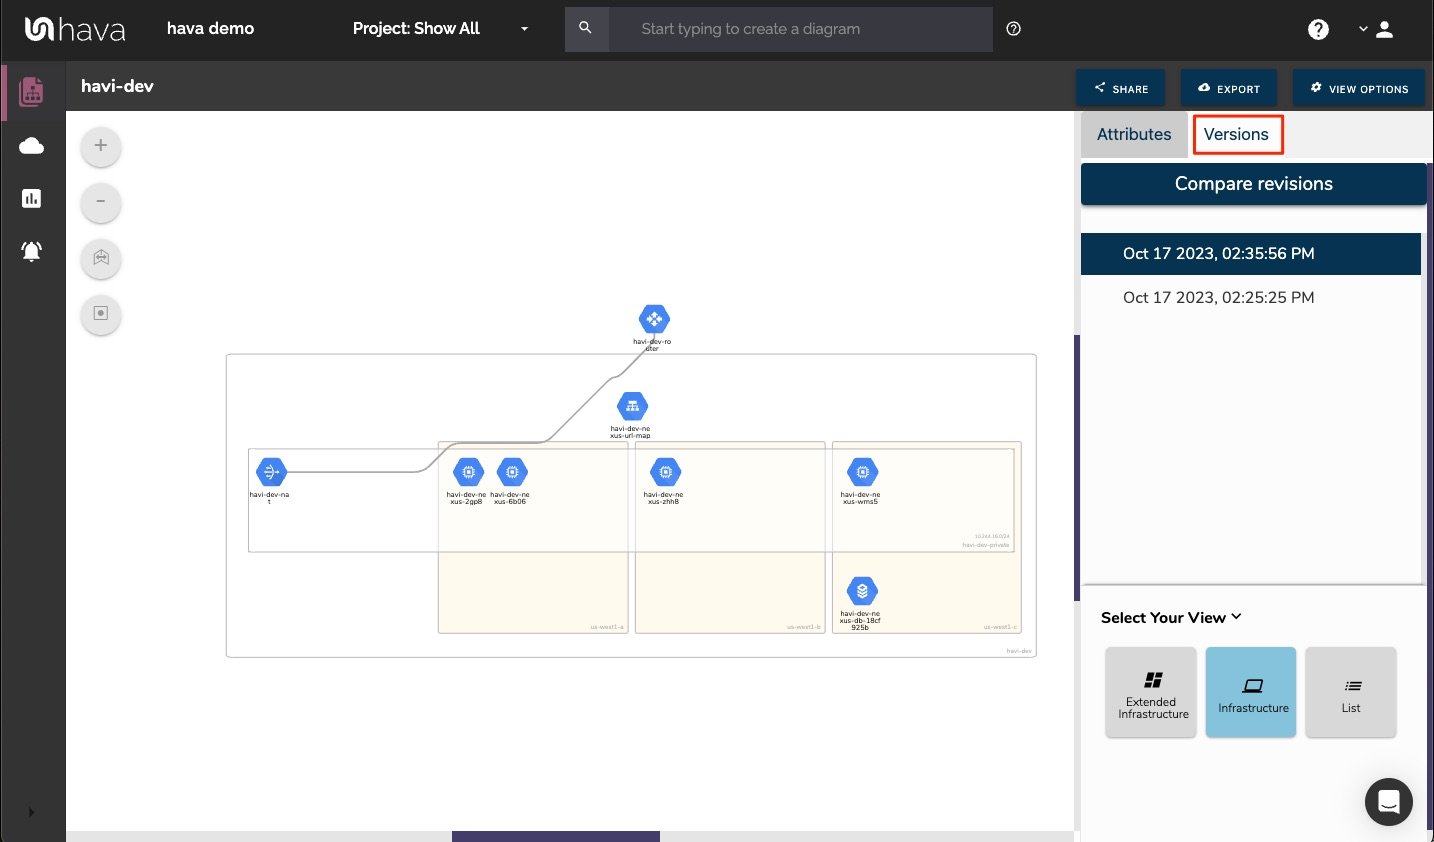
Because the update process is automatic, once a configuration change is detected, a new diagram set is spawned and the superseded diagram set is placed in the version history. You can select an older version to view and it remains fully interactive, not just a static diagram), so you can select resources, inspect their attributes and settings just as you can on the live diagrams.
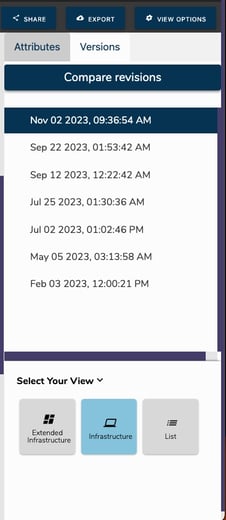
You now have the ability to selecting an older diagram from version history, so you can pull up the older version in a separate browser and compare current azure infrastructure diagrams side-by-side. This makes it easy to visually detect the differences and get to the root cause of application or performance issues when they occur.
You can also export your current and superseded auto generated Azure diagrams in JSON format and Diff the files to programmatically surface all the changes .
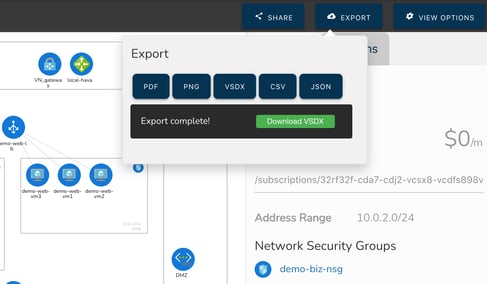
All the interactive diagrams are exportable in a number of formats.
There are currently no mechanisms within Hava to draw diagrams from scratch or to add or remove resource elements. Hava diagrams are designed to always reflect the source of truth at any point in time. You can alway be confident that what you are looking at on a Hava diagram reflects reality because there is no way to manually add or remove diagram elements and resources.
We do however appreciate that sometimes you would like to use a diagram as a starting point for some redesign work, or you would like to annotate a diagram to explain elements of the diagram for various reasons, like in management or sales presentations.
Auto Draw Azure Diagrams for Visio
The Hava VSDX export option is the solution, enabling you to export your Azure infrastructure diagrams in Microsoft Visio format. You can then use Visio or a compatible application to import the diagram for manipulation.
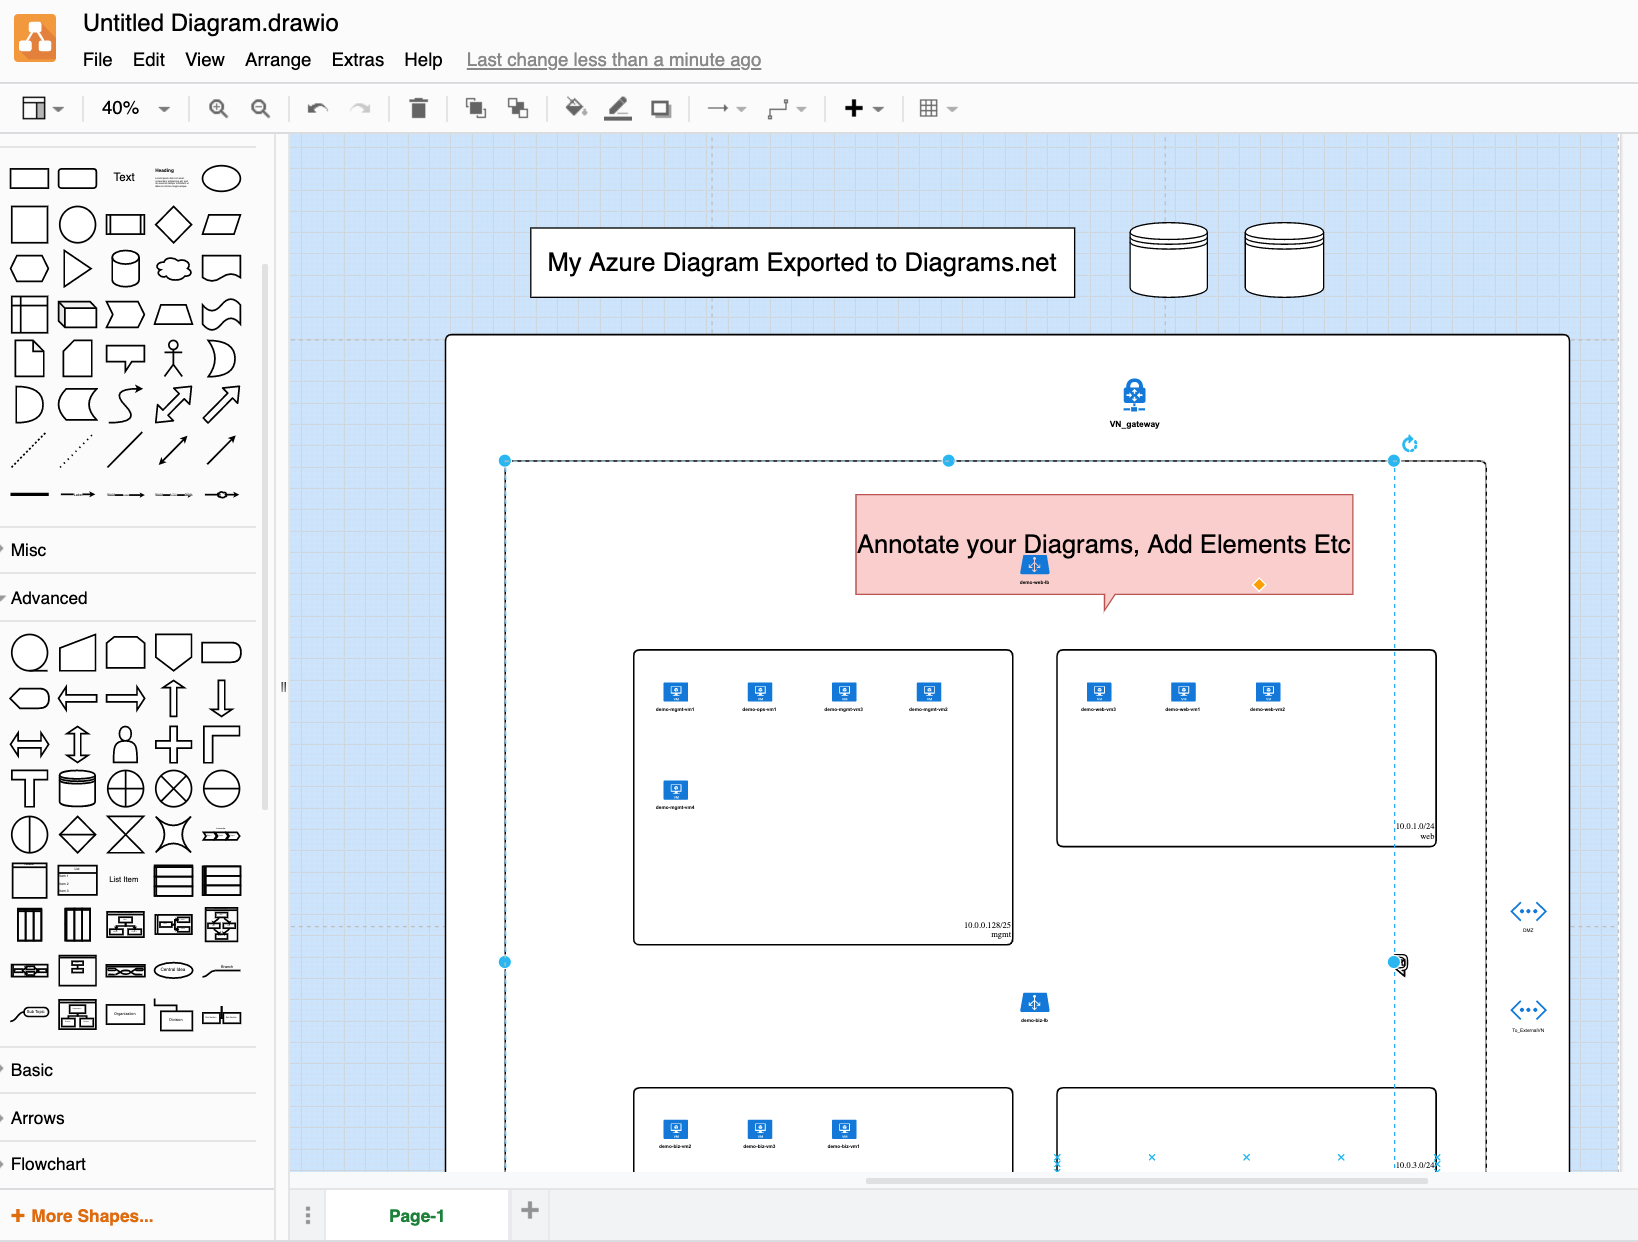
This provides the flexibility of editable diagrams while also maintaining the integrity of the diagrams and data held natively within Hava, so you have an unquestionable source of truth reference during a PCI compliance, Insurance or other type of audit.
Because you have the ability to manually sync your data sources within Hava, you can always guarantee you have a "live" version of your network whenever you need it.
Azure Network Diagrams
On top of the standard infrastructure and 3D diagrams, there are two more diagrams in the Azure Visualization diagram set that are produced automatically by Hava.
The extended infrastructure view is similar to the infrastructure view, however it adds some more metadata to the diagram like full resource names and resource sizes.
The other diagram is the "List View". This report is, as the name suggests, a list of all the resources discovered in your environment.
This includes elements that are not visualised on the diagrams. Some resources may have dozens or hundreds of reasonably unimportant instances like network interfaces or virtual machine extensions, which if visualised would make the diagrams unreadable.
The list view is where you can find these resources. The resource list can be filtered, sorted by name, type or price and exported to CSV for easy import into a spreadsheet for cost analysis.
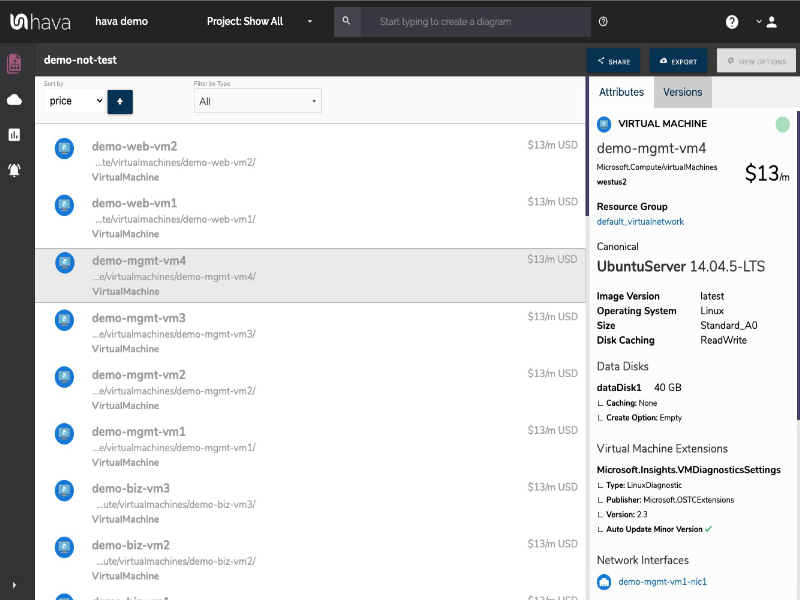
The visualised resources are detailed below. The elements in the attributes column signify that they are not displayed on the infrastructure diagrams but do appear in the list view.
|
|
Visualised |
Attributes |
|
Application Gateway |
✓ |
|
|
Availability Set |
|
✓ |
|
Express Route |
✓ |
|
|
Load Balancer |
✓ |
|
|
Local Network Gateway |
✓ |
|
|
Network Interface |
|
✓ |
|
Network Security Group |
|
✓ |
|
Public IP |
|
✓ |
|
Redis Cache |
✓ |
|
|
Resource Group |
✓ |
|
|
Route Table |
✓ |
|
|
SQL Server |
✓ |
|
|
Storage Account |
✓ |
|
|
Subnet |
✓ |
|
|
Virtual Machine |
✓ |
|
|
Virtual Machine Extension |
|
✓ |
|
Virtual Machine Scale Set |
|
✓ |
|
Virtual Network |
✓ |
|
|
Virtual Network Gateway |
✓ |
|
|
Virtual Network Peering |
✓ |
|
