
When you are building cloud solutions, taking on new client networks or inheriting a project, having up to date documentation is massive advantage.
What used to be a manual labour intensive task can now be achieved in minutes by connecting your AWS, Azure, GCP and Kubernetes Clusters to hava.io and letting Hava auto generate your architecture topology diagrams for you.
You no longer have to do it yourself, waste your cloud architect's time trawling through consoles or engage consultants to produce accurate perpetually up to date cloud architecture, container and security posture diagrams.
Free yourself from drag and drop forever.
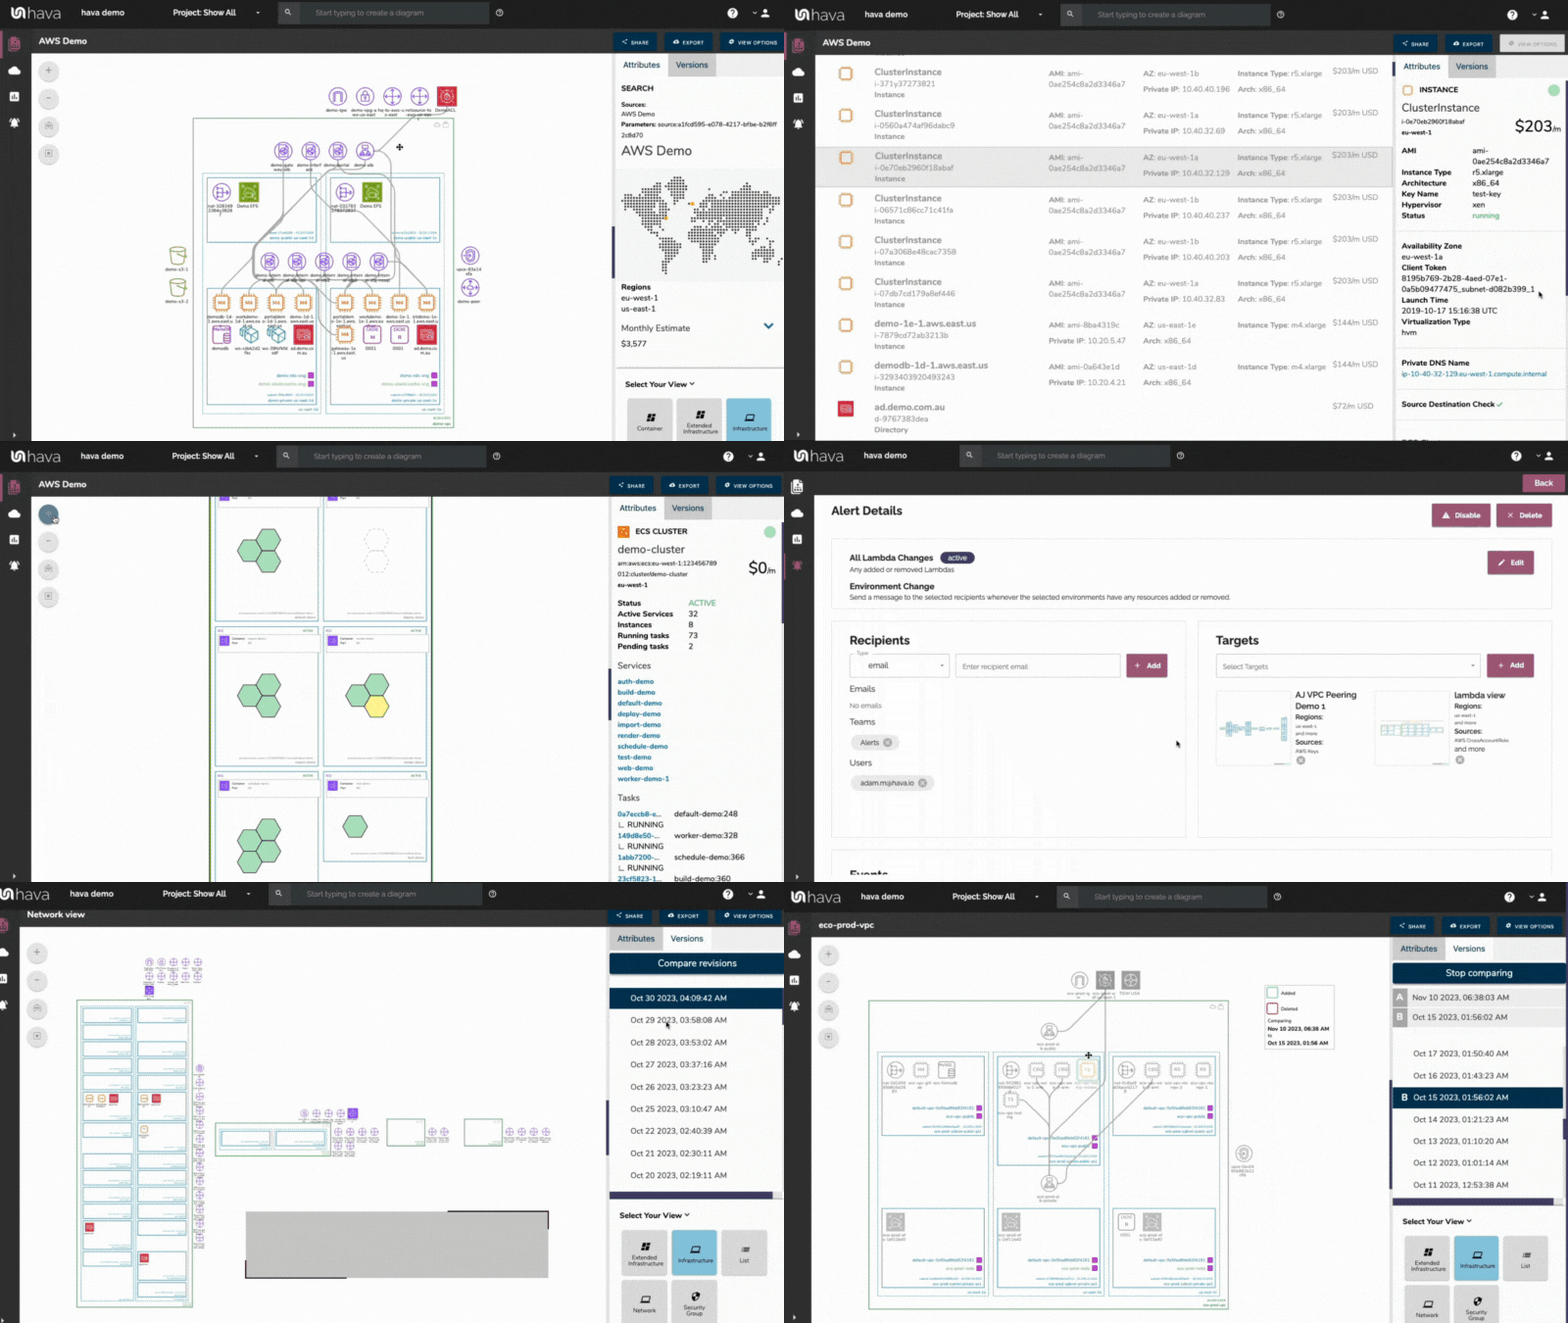
When you auto generate diagrams that automatically keep themselves up to date, you free up your time, your architects and engineers time and still have accurate diagrams on hand to help diagnose problems when they occur.
Visualised cloud architecture surfaces anomalies that can be difficult to spot in cloud console settings. You get to see what is running where across all your connected cloud accounts including multi cloud deployments. This means you can spot anomalies and outliers that you wouldn't go looking for in you consoles, but are potentially costing you a lot of money but are buried in your cloud provider bill.
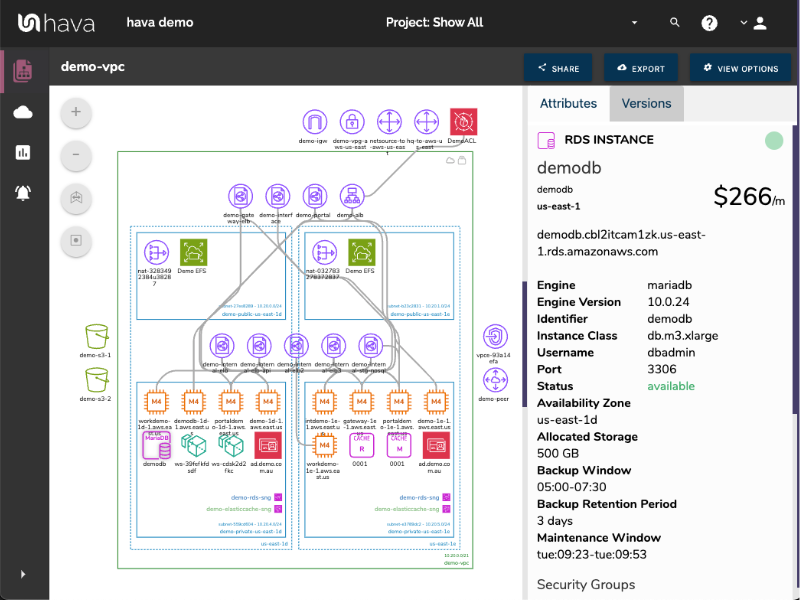
Hava keeps all your diagrams up to date on auto pilot. As changes are detected, new diagrams are produced and superseded diagrams moved to version history, even if you haven't logged into Hava. There is no need to manually trigger updates, it's done for you. However if you need to diagram changes immediately you can sync whenever you like, either via the Hava app, pipeline integrations or via API.
When changes are detected in the configuration of the cloud accounts you are managing, Hava can trigger an alert that lets your know when that change is detected.
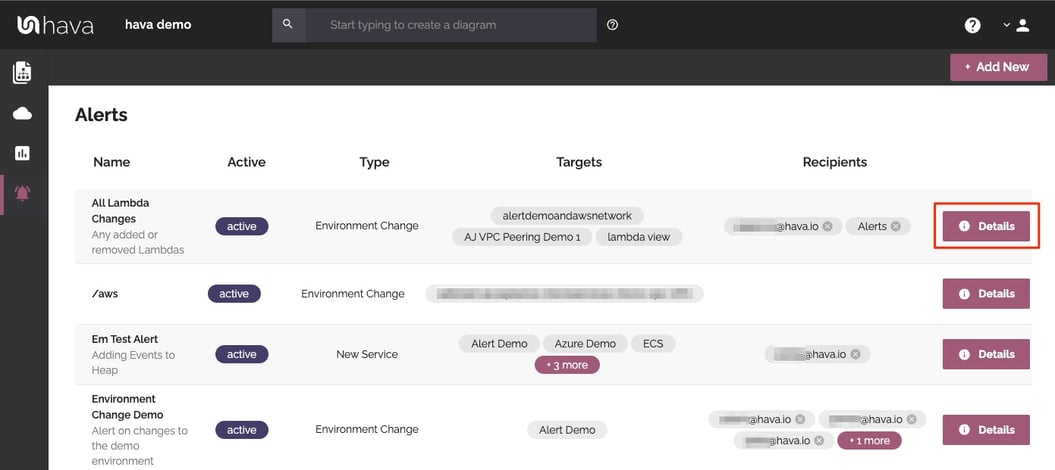
This means you always know what is happening in your cloud accounts and for MSPs it means you can let clients loose on their own infrastructure and resources but you can keep an eye on the changes and can warn them of any security or cost implications of the deployed changes - no more bill shock!
As changes are detected in your cloud configs, Hava stores superseded diagrams in version history automatically. You can compare any two interactive diagrams from any point in time using the revision comparison feature built into Hava. This shows you exactly what resources have been added, and which ones were removed during the time period between the two diagrams.
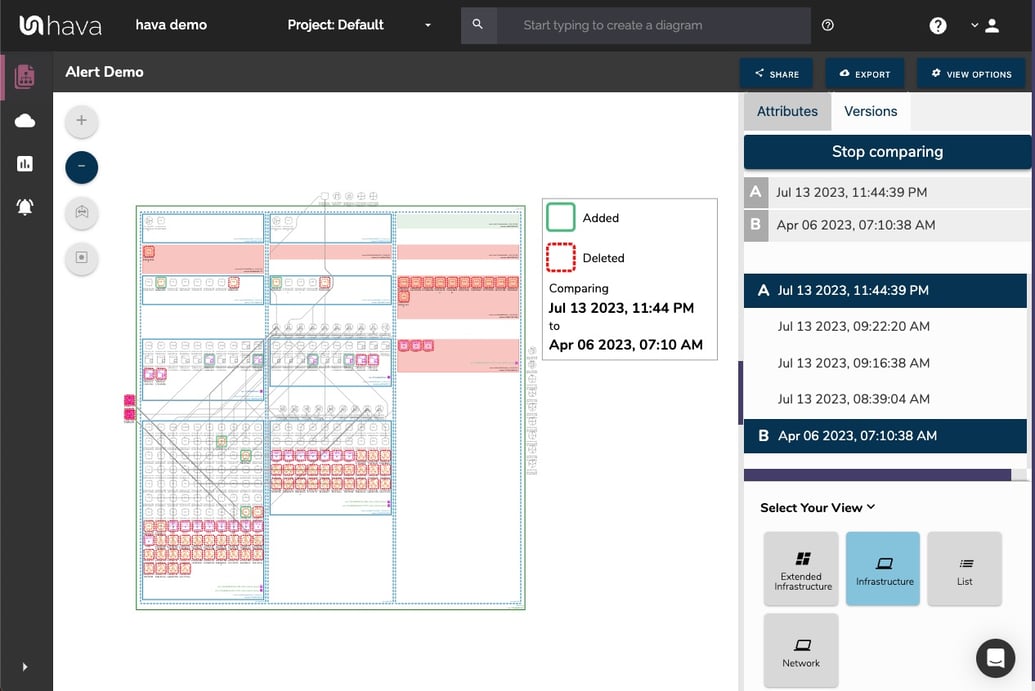
This could be the current live architecture diagram vs one from yesterday should you need to troubleshoot sudden unexpected application errors, or you could compare architecture over a longer period of time, like the period between PCI compliance audits so the auditors can see the changes they are interested in. You can also use diff views to analyse architectural drift or show clients the changes that have happened over time that have prompted questions around billing and escalating costs.
The query tool built into Hava is a powerful search function that can interrogate hundreds of cloud accounts across multiple vendors simultaneously with a single command.
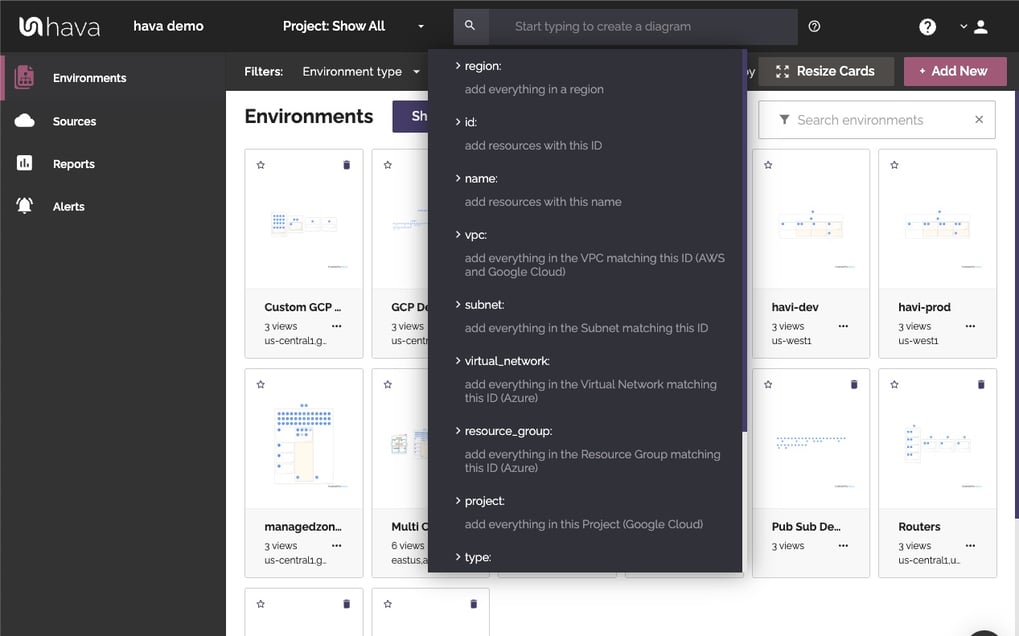
You can search for tags, resources, IP addresses, resource types, names and a whole host of other search parameters and combinations to locate matching cloud resources, no matter what vendor or cloud account they are located in. Now there is no need to log into hundreds of consoles to locate the asset you are looking for.
Need to identify all the AWS VPCs with a particular database type running? Even if you are an MSP with thousands of accounts under management, Hava makes it possible with a single centralised query.
Speed up On-boarding - When you take on new engineers or engage cloud consultants, having accurate up to date diagrams means you can show them exactly what you have deployed in a format that is easy to comprehend.
See What's Running Where - When you inherit environments the first question you ask is what is running where. Connect to Hava and you have the answer. The same is true if you are managing lots of accounts. The first step is to see what is running where before you start troubleshooting.
Compare Architecture Over Time - Easily see the changes made to a VPC in seconds. Select any two diagrams from versioning to see the resources added or removed between those dates. Help conquer architectural drift and explain why costs have changed, demonstrate why the architecture no longer resembles the original design and why security may need to be reviewed.
Never Start From Scratch - Before starting architecture redesign or a performance improvement proposal, you can turn to Hava for a picture of what is running now. You can then document your proposed changes without having to draw complex networks from scratch.
Track Changes - When changes are detected in your cloud config, Hava automatically generates new diagrams and saves the previous diagrams to version history. So when you want to identify resource changes in the middle of an outage, or compare cost changes, you can. This is especially useful during ISO/PCI/SOC audits when you need to identify changes since the last audit.
Embed Diagrams Anywhere - You can embed fully interactive Hava diagrams outside of the application, like in say a Wiki, in Github or any web property. Diagram endpoints can be placed once, and as your diagrams update, the embedded diagram automatically updates too. This means your Confluence page, GitHub doco or intranet stays up to date automatically, hands free.
CMDB Validation - When you are maintaining a cmdb, you can drop in a diagram link so you can view the cloud asset in context
Validate your AWS Compliance - Using the built in AWS compliance report, you can see how well your AWS configuration complies to best practice and well architected standards. The report will highlight potential problems, the severity of the issue and suggest solutions.
Monitor Container Tasks - Hava's container view visualises the run status of your cluster tasks or pods. You can see at a glance the health and status of your cluster and any pods or tasks that are in a sub optimal state.
"Hava has grown into a comprehensive tool for mapping out entire network topologies, in minutes. Rather than spending hours trawling through cloud consoles, firing up needless drawing tools or having new customers dig through historical data, Hava automatically generates a full layout of the new cloud environment."
Callum Davies - Managing Director, Asia

When you connect Azure and AWS to Hava, you will generate a security view that details all the configured security groups on your virtual networks.
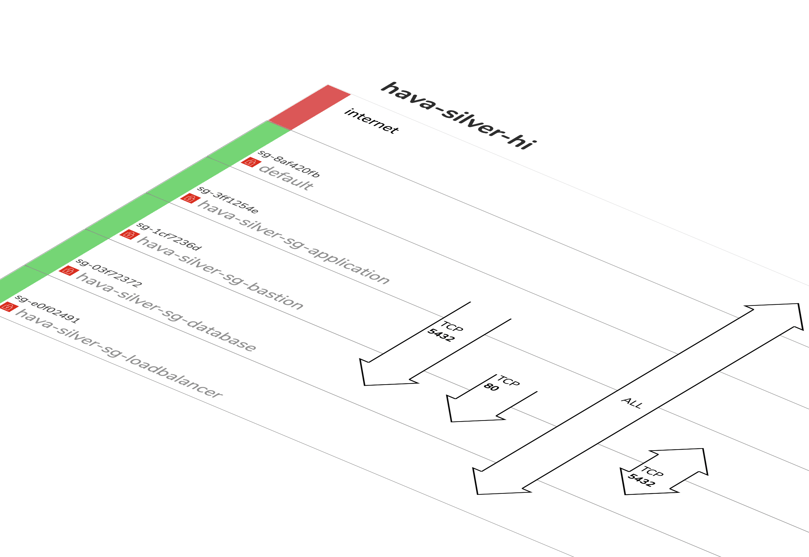
This interactive diagram shows all your security groups and when a SG is selected you can see all the connected resources, ingress and egress IP details and other relevant metadata. The overlaid arrows show you how traffic enters and exits your network with details on the ports and protocols in use.
This allows you to show your security team your cloud security posture and when used in conjunction with the infrastructure view diagram, they will better understand how your network hangs together. They will visually understand what is going on and where attention may be needed without spending days checking individual cloud resources in the console.
In terms of Hava security, the app connects via read only credentials and scans configuration settings only, no client data is read or stored. Data required to generate diagrams is encrypted in transit and at rest and the entire application can be self hosted on your own cloud infrastructure behind your own security.
There are a number of ways to integrate diagrams and trigger actions outside of the Hava application.
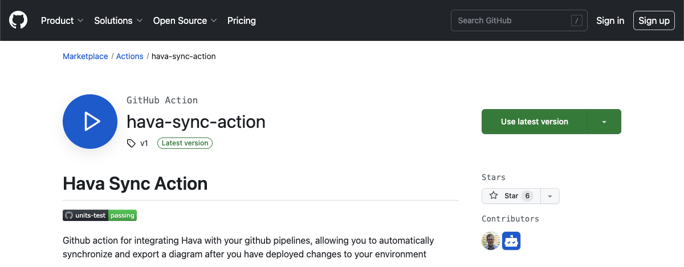
GitHub Integration - Available on the GitHub marketplace, the Hava sync action allows you to trigger diagram updates and optionally retrieve updated diagrams to your Github Docs repo from within your deployment workflow.
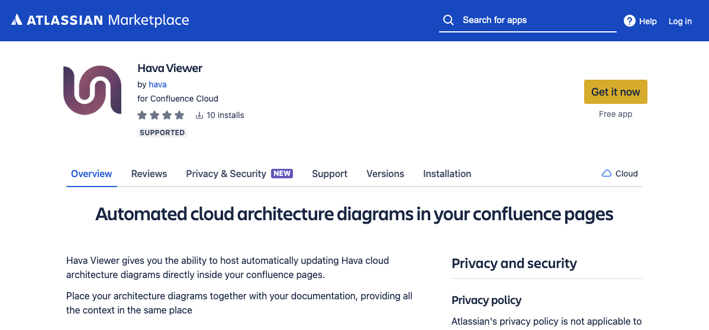
Confluence - The Hava diagram viewer is available on the Atlassian marketplace and allows you to easily insert interactive diagrams into Confluence.
Embeds - Have provides the ability to embed your diagrams via iFrame code snippets. This means you can embed interactive diagrams anywhere that supports iFrames, like Notion, other web apps, the list is endless. The embeds utilise a dynamic URL that hosts the latest diagram version, so you only ever have to embed once.
API - Hava has an API you can use to programatically perform the operations you can within the application UI. You can add and remove data sources, trigger diagram updates, retrieve diagrams using API calls. This means you can build diagramming into your CI/CD pipeline or perform bulk actions using code and not the Hava app.
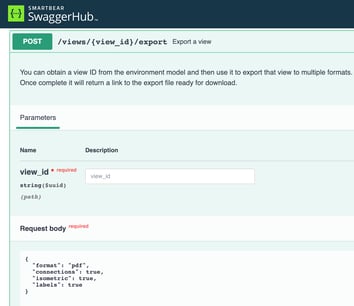
CLI - Hava's CLI provides the ultimate control over the integration of Hava operations and your CI/CD pipeline. Connect and sync data sources and diagrams from your favourite CI/CD tools like Github, GitLab, Azure DevOps, Circle CI, Buildkite, Jenkins and more.
AWS Control Tower - Integrate Hava into AWS Control Tower. As you add more AWS accounts to your org via the vending process, automatically add them to Hava.
Export - You can export diagrams for analysis, archiving, use in proposals or management reports or for editing. The PDF and PNG file formats provide formatted diagrams, the VSDX export allows you to edit the diagrams using Visio, draw.io or other compatible editors, whereas the CSV and JSON exports provide the raw data you can use to diff or ingest diagram data into other applications.
If it sounds like Hava can help save you time and money diagramming your cloud environments, help you keep track of changes and help you find resources across multiple cloud accounts and vendors with a single query, you can sign up to a free 14 day trial here: There's no obligation or credit card required.
If you have any questions, please get in touch using the chat facility at the bottom of this page or via our contact page.
Thanks for your interest.