Auto scaling AWS resources in your cloud infrastructure protects the performance of your applications when they are placed under heavy traffic or processing loads.
The ability for AWS to spin up new compute instances when needed and to then scale them back when the load subsides is one of the major benefits of cloud computing that on premise networks can only dream of.
But how do you track what is going on prior to your monthly AWS bill arriving.
With auto scaling, resources can be added and then removed without any action needed on your part, so if you are not watching your cloud config 24/7, sudden spikes in traffic might trigger scaling events that have come and gone by the time you log into your cloud console to see what is going on.
If the increase in traffic is steady and sustained, then the resources added by the auto scaler will still be there for you to see. If your scaling event was in response to a load spike, then when you look at the network , it might not be apparent that extra resources were provisioned.
Autoscaling groups are among the many resources auto detected and visualised on Hava network topology diagrams. When an ASG is present, typically it will place instances in multiple regions. Hava will draw the ASG in all the regions it has been replicated and when clicking on any of the related instance nodes, all the other associated ASG nodes will be highlighted so you can easily see where the ASG is running.
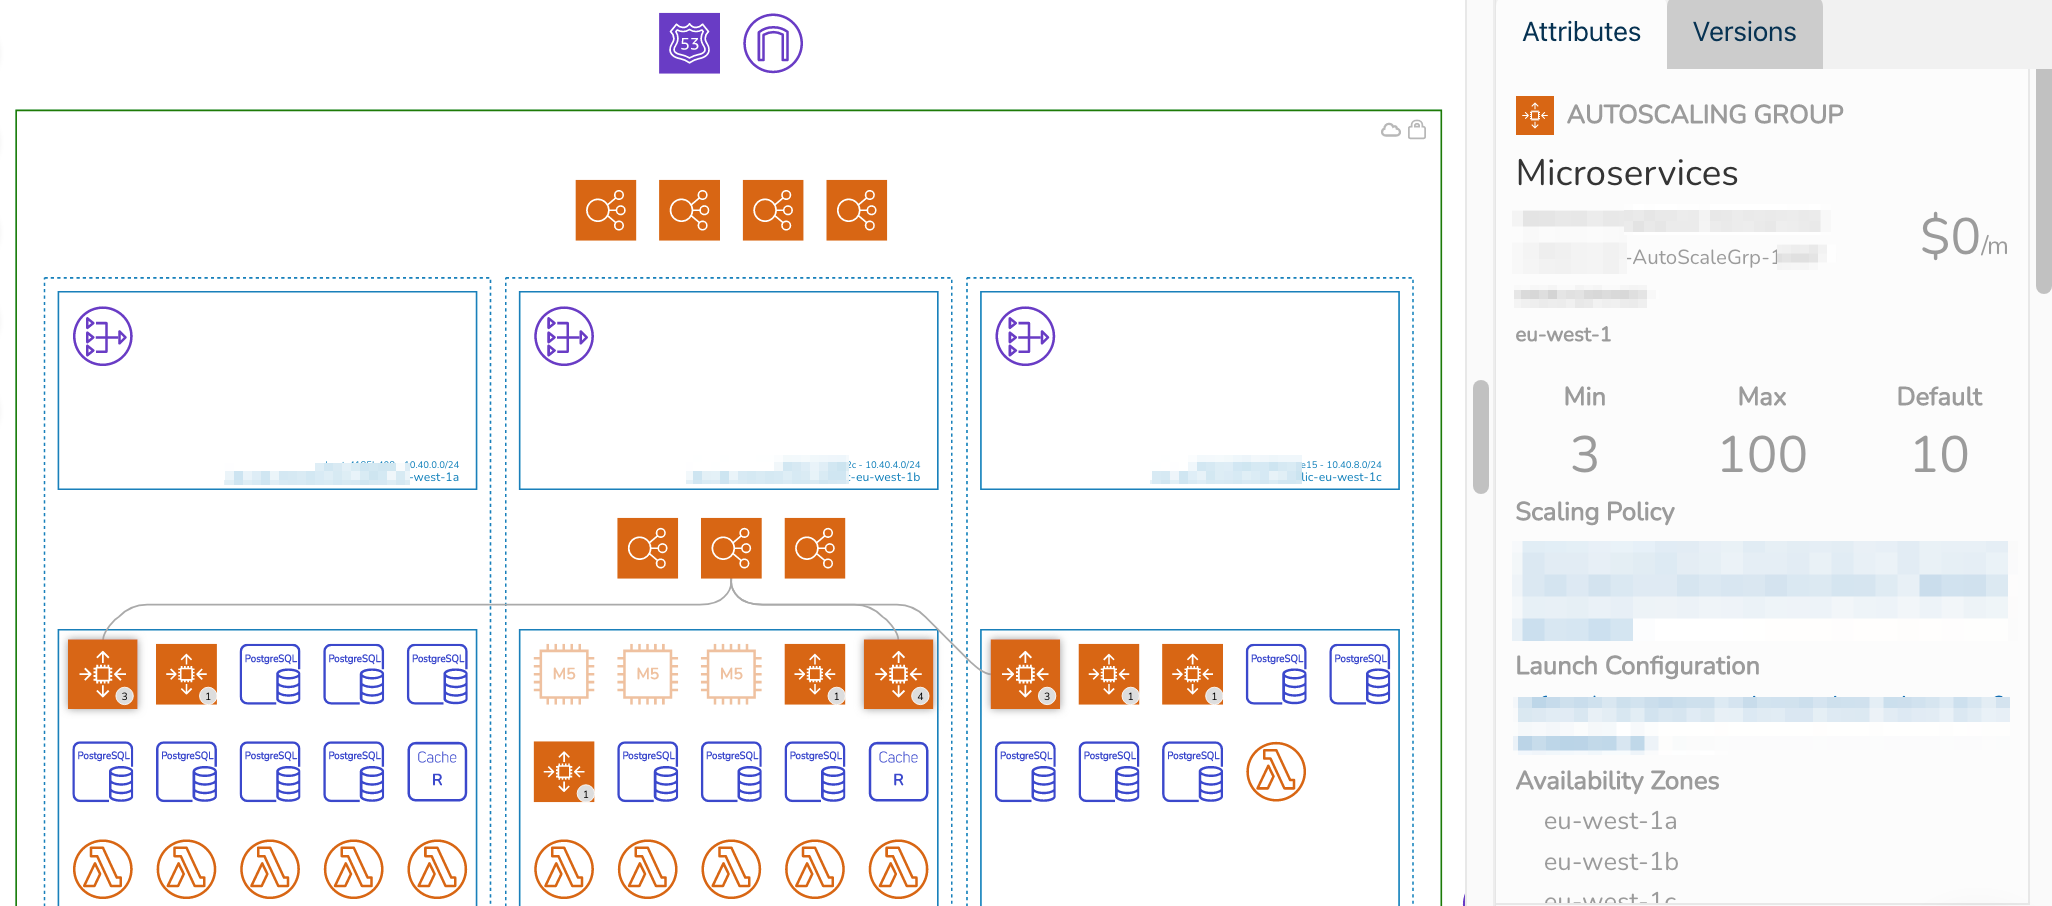
The auto scaling group icon will also display a number which indicates the number of instances running within the group. The meta data displayed in the side attribute panel when an ASG is selected on the interactive diagram will also display the minimum, desired and maximum number of instances configured in the group, so you can see at a glance whether the your configured instance numbers are being maxed out.
Inspecting the current Hava infrastructure view of a network with auto scaling groups running shows you what is running now and where it is running, however if you are investigating cost or performance issues, you may like to see what changes have occurred that may have impacted such things.
This is where the versioning feature of Hava comes into play.
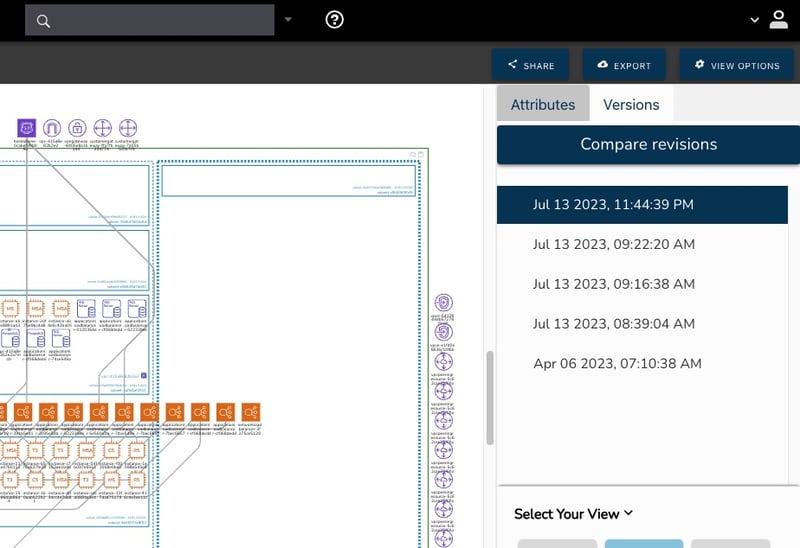
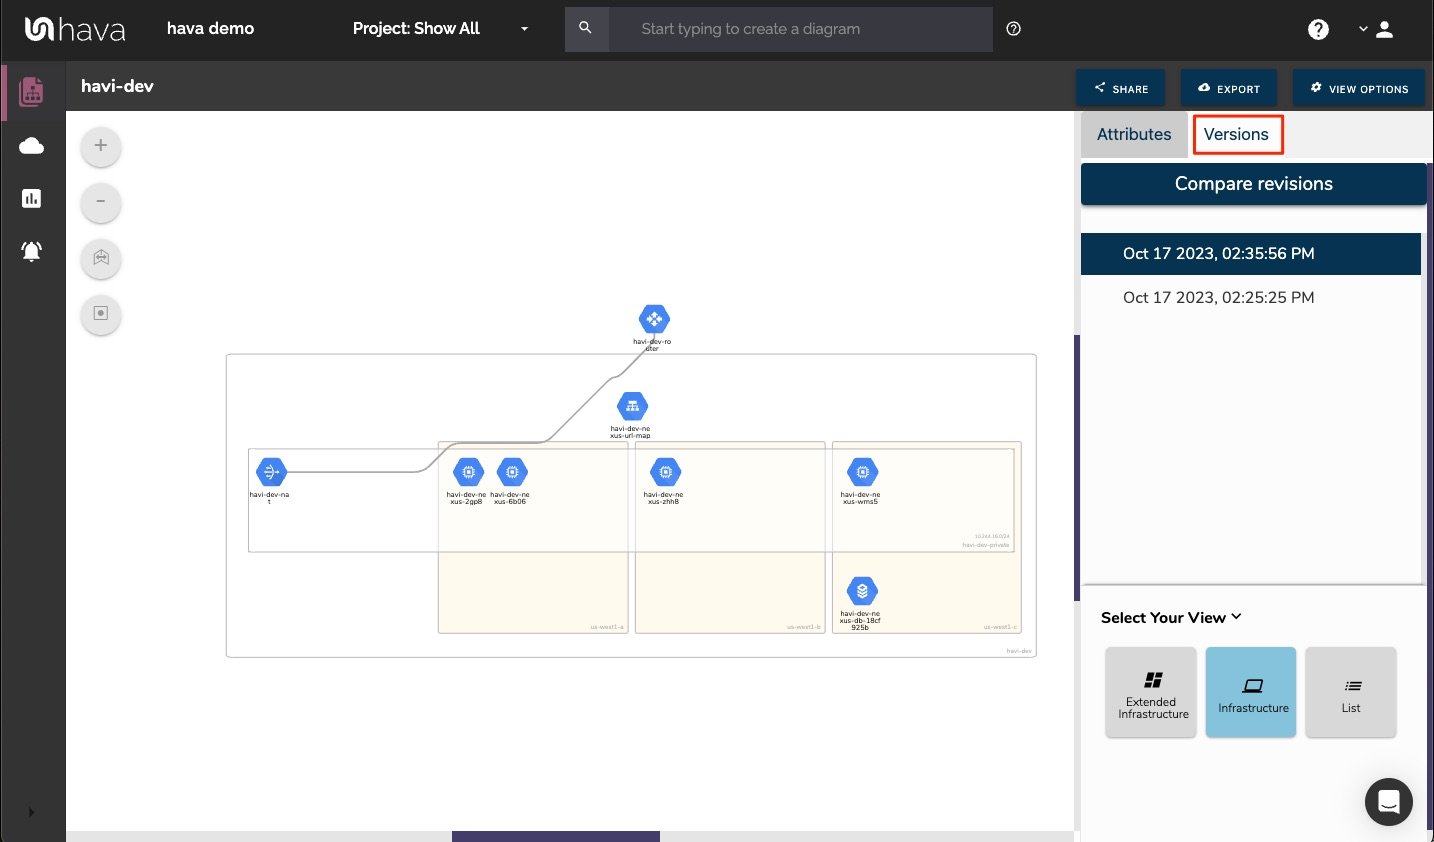
Every time a change is detected in your cloud configuration, like extra EC2 instances being added during a scaling event a new diagram version is created and the superseded diagram is placed into version history.
This happens during the scheduled sync automatically however you could set up an event listener and trigger a sync using Hava's API when a scaling event is detected should you wan't diagrams instantly updated.
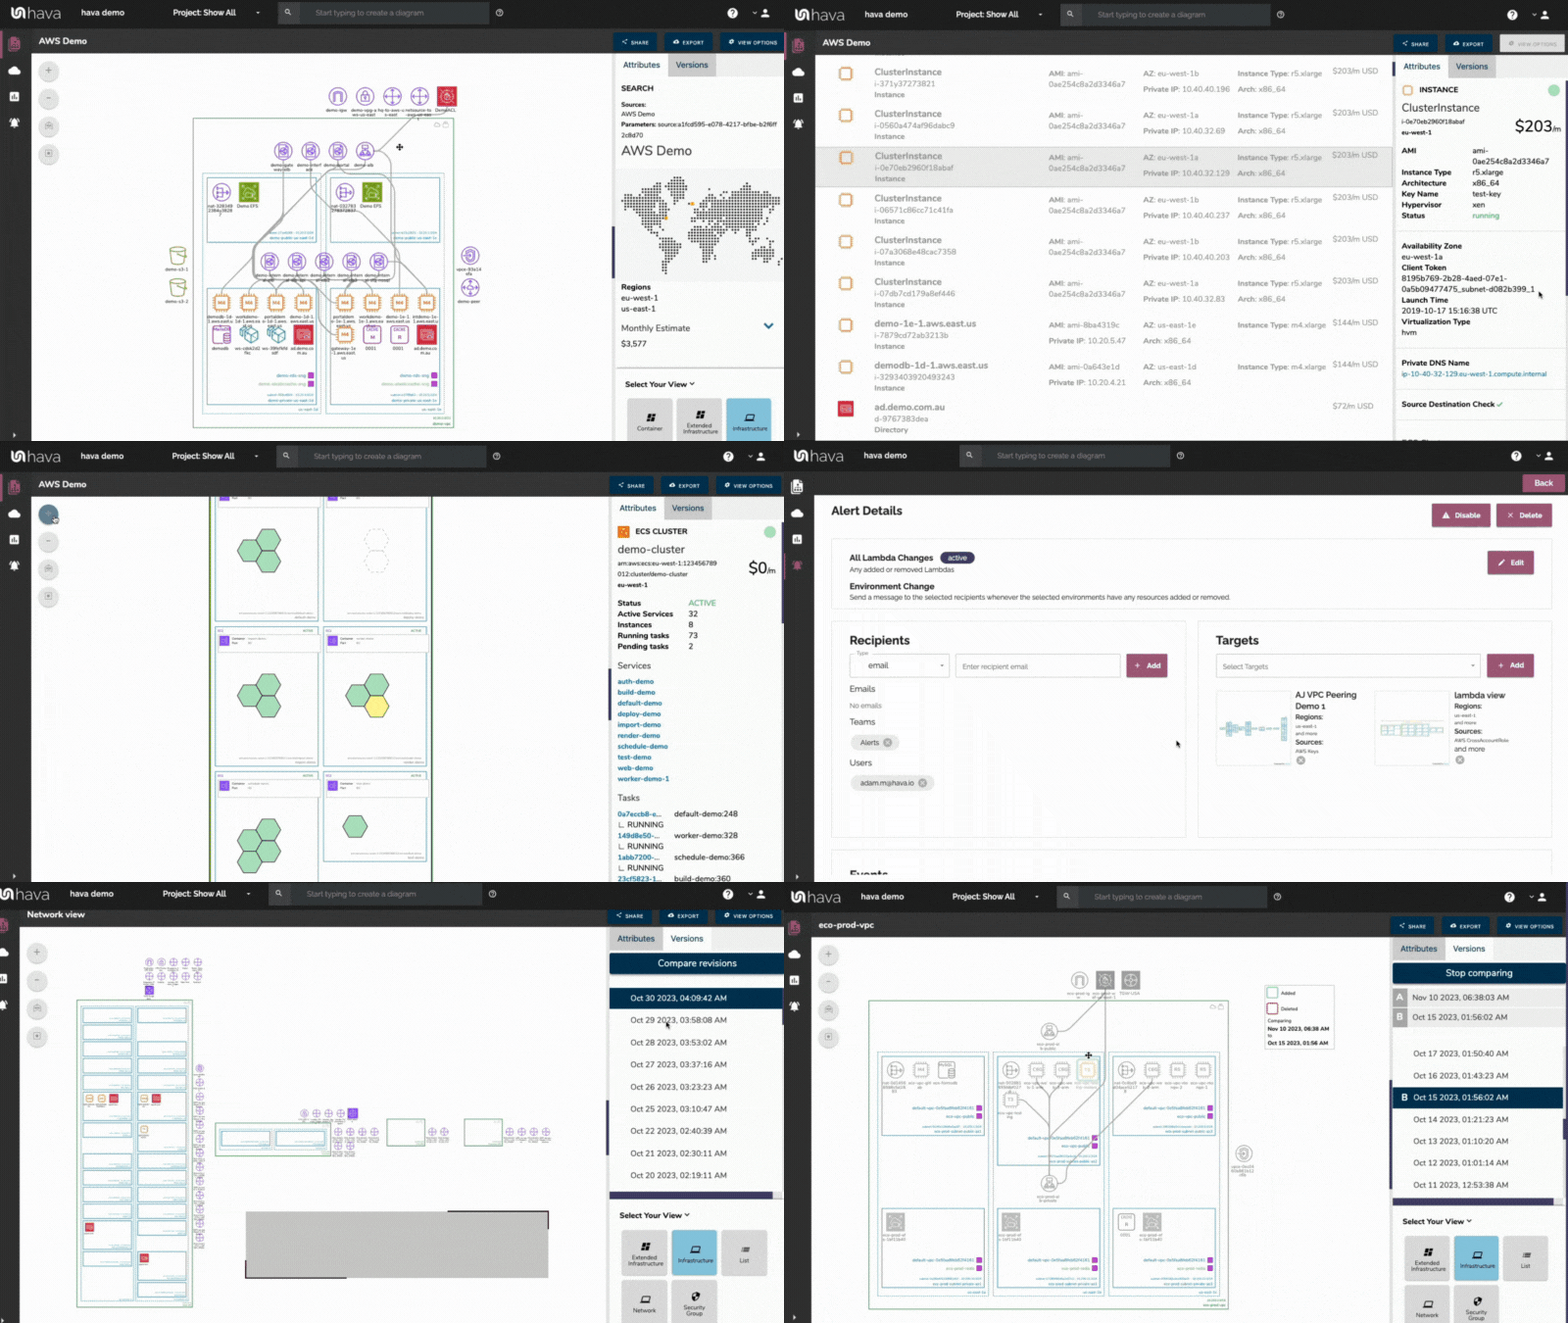
What you then have is an archived version of your network infrastructure that you can compare to the current running version so you can easily determine whether resources have been added or removed during scaling events.
Since versions are retained every time your network infrastructure changes, you have the ability to step back through the versions to see changes that have occurred over time. This applies to all your deployed resources, not just auto scaling groups.
If you specifically wanted to monitor all your auto scaling groups across multiple AWS accounts on a single diagram, you can use the built in search functions in Hava to create a custom diagram featuring just auto scaling groups.
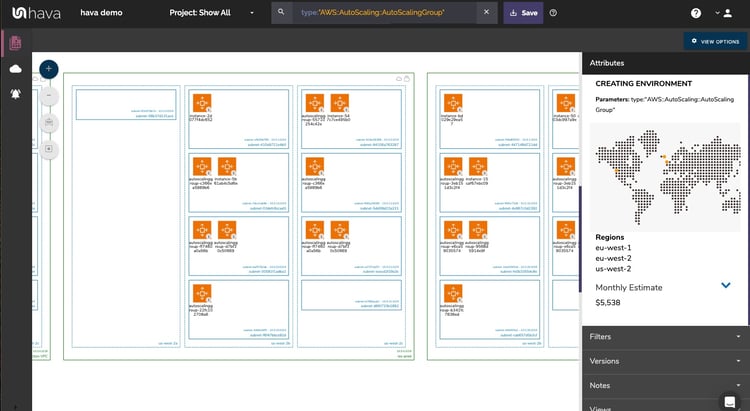
The resulting diagram will allow you to monitor ASGs across all the AWS accounts connected to your Hava account from one diagram. Once saved, this custom diagram will stay updated hands free, so you always have an up to date mechanism to monitor your AWS Auto scaling groups without having to log into multiple management consoles.
If you would like to make this or any other diagram available to team members that don't have a Hava log in, using the embedded diagram viewer, confluence plug in or GitHub action you can place diagrams in any number of locations like a company Wiki or Doc repo that you can view without needing Hava credentials.
The embedded diagram endpoints are dynamic, so as Hava syncs your data sources and updates diagrams, the embedded diagrams are also updated automatically.
If you are not currently leveraging Hava to automate your cloud network documentation, you can follow the button below to take a free 14 day trial and check out exactly what you have running across your entire cloud including Azure, GCP and Kubernetes

